2021 Grains, oilseeds and pulses sector outlook

FCC Economics helps you make sense of the top economic trends and issues likely to affect your operation in 2021. The three major trends to monitor for grain, oilseed and pulse operations include:
Limited supplies and tight projected stocks-to-use ratios
China’s influence on markets
COVID’s hangover: currency fluctuations in a year of economic re-stabilization
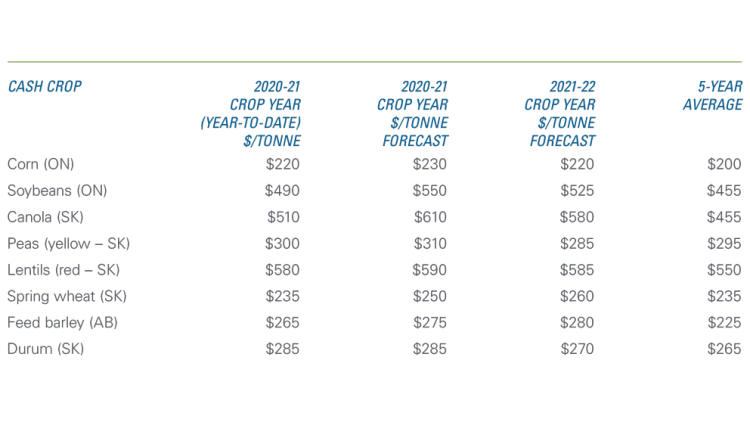
2020 was a year unlike any other for so many reasons. In Canada, the overall production of grains, oilseeds and pulses was a record high, with most crops (except canola) seeing year-over-year (yoy) production gains. We project that most Canadian grain, oilseed and pulse prices will continue to benefit from tight global supplies and strong world demand (Table 1).
The year-to-date crop prices (except for durum) are better than the annual 20-21 forecast. It’s a strong reflection of the major surge in commodity prices that started early in the fall of 2020. For the most part, prices for the 21-22 marketing year crop are projected lower, but still expected to be higher than their respective 5-year averages.
Table 1: Prices for most crops remain higher than 5-year average throughout 2021
Sources: Statistics Canada, AAFC, USDA, CanFax, CME Futures, and FCC calculations.
Farm input prices on the rise
With higher crop prices expected in 2021, each crop supply is forecast to increase in most cases. That will drive higher demand for fertilizer, causing a surge in prices for urea, ammonia phosphate and potash.
Other crop input prices (e.g., seeds and pesticides) will also likely increase ahead of planting in the spring, softening crop margins. The 2021 soybean-corn ratio, based on November 2021 soybean to December 2021 corn futures prices, suggests U.S. farmers will favour soybean over corn acres. That competition for acres will directly influence nitrogen demand and fertilizer prices.
Farmland values are expected to stay elevated throughout 2021 due to the low interest rate environment and strong 20-21 crop receipts. Check back with us in March for the 2020 FCC Farmland Values Report results and our expectations about trends in rental rates and land affordability.
Wheat
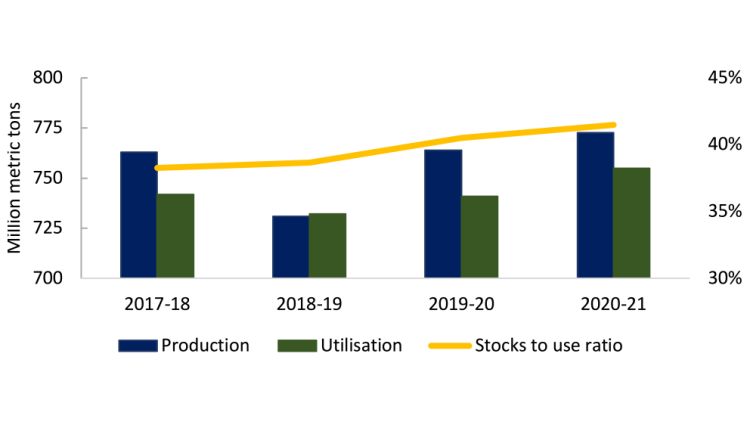
Argentina’s 20-21 wheat crop, estimated to be the smallest in five years, will help keep the 20-21 global wheat production forecast to 773.4 million metric tons, a slight 1.2% yoy growth. Those lowered forecasts offset Russian wheat production, expected to be a record high. Global wheat ending stocks are expected to be 304.2 million metric tons, 1.4% higher yoy and the highest in 5 years (Figure 1).
Figure 1: Prices trending up despite expanded world wheat production
Source: USDA-FAS.
Bullish corn and soybean markets have helped push wheat prices higher early in 2021, as has news of wheat export restrictions in Russia and rumoured export taxes in Argentina. Elevated stocks won’t necessarily hurt further price projections (Table 1). First, the U.S. wheat stocks-to-use ratio is falling. Second, Canada’s export pace of the 20-21 crop remains strong. It’s a reassuring trend given Canadian production rose 7.7% yoy (to 35.2 million MT) – the second-largest volume in the last 10 years).
Higher prices suggest positive profit margins in the current and next marketing year. Despite that, we believe that the large upside for canola production may result in no growth of Canadian wheat acres in 2021. Yields returning to trend would result in a smaller 2021 crop and support prices.
Corn
Global corn production for the 20-21 MY is estimated to increase 1.6% to 1.13 billion MT. Although La Nina has already landed in South America, Argentinian corn production is still expected to be near a record high, and in Brazil, the largest ever recorded.
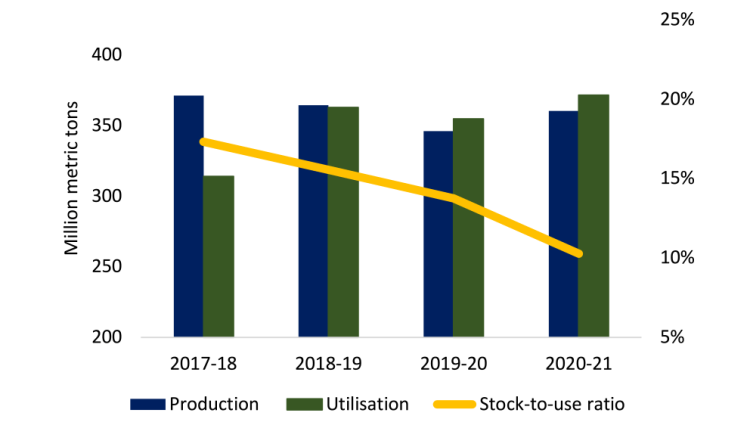
The global corn stocks-to-use ratio is declining, and so is the U.S. ratio (Figure 2). China’s growing use of corn as they rebuild their hog herd drives much of the expected demand (see Trend #2 below). The USDA is now projecting a whopping 216% yoy increase in China’s corn imports for the 20-21 MY, on top of a 70% increase in Chinese imports during the 2019-20 MY. And there are reasons to believe these projections are conservative!
Figure 2: U.S. corn supplies to dwindle on export growth, demand for feed and fuel
Source: USDA.
Strengthening export demand for U.S. corn will continue, but utilization projections face multiple wildcards. Total red meat and poultry production is projected up slightly in 2021, which should maintain feed demand. As well, the ethanol industry may rebound after a bumpy 2020. At the worst point last spring, ethanol production was at half of pre-pandemic industry capacity. It now appears to have stabilized at a pace that’s 10% under the pace of early 2020. Resuming steady ethanol production equivalent to the 2018-19 MY could easily push corn’s stocks-to-use ratio under 10%.
Rising corn prices (Table 1) are expected to trigger an increase in seeded acres. If yields in 2021 follow the expected trend, we would likely record an increase in supply for the 21-22 MY, putting a lid on the possible appreciation in the domestic corn price. Overall, however, margins will be well supported.
Soybeans
In 2021, the soybean story is one of higher overall yoy production and even stronger demand that will, in some cases, pressure or break records. Brazil, the world’s largest soy producer, is expected to harvest a record or near-record crop despite La Nina’s threat, and all major producers are up from 19-20 MY production. Argentina is the big unknown. Dryness there may hinder further crop development, and current labour disputes make loading and deliveries uncertain.
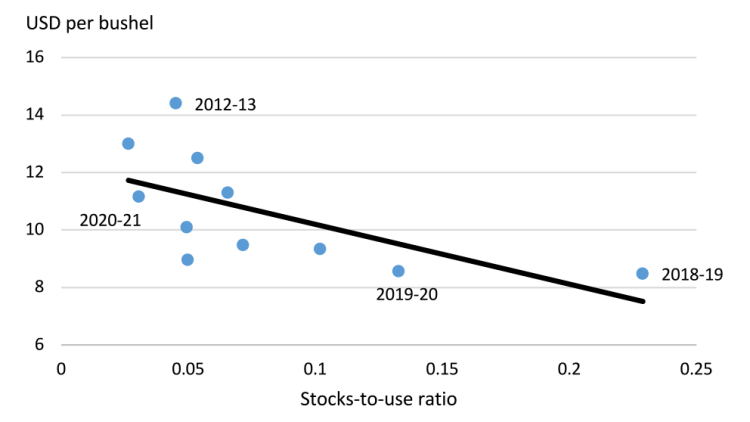
Total demand for soybeans is also up for the 20-21 MY, with China well in the lead. Successfully rebuilding their hog herd, China’s need for feed has catapulted from 2018 when demand fell due to African Swine Fever, and it has grown beyond pre-ASF levels. Strengthening demand has resulted in a U.S. 20-21 MY stocks-to-use ratio (Figure 3) that’s lower than the 2012-13 ratio, the year with the last major drought.
Figure 3: Average U.S. soybean price climbs as year-end stocks-to-use ratio falls
Source: USDA.
Regardless of supply or demand shocks, prices are more volatile when stocks-to-use ratios are low. However, while elevated prices may continue throughout the next marketing year, large volumes of soybeans will come to market. Prices could also drift lower if Chinese purchases slow.
Overall, projected strong returns for soybean production are expected to lead to more seeded acres overall in 2021, and to reversing three consecutive years of decline in Prairie acres.
Canola
Canada’s canola producers are set to have an excellent year, with prospects for demand growth primarily limited by available supplies. The Chinese-led demand growth has helped push prices for oilseed markets overall, with demand for protein meals and vegetable oils also very strong.
With a 5-year average stocks-to-use ratio of 14% and a 2019-20 average of 15%, Canada’s ratio is expected to fall to 6% in 2021, a record low. Strong domestic demand and export growth will drive the shifting balance. With that support, we project seeded acres to grow yoy and production to increase with expected trend yields.
Should China slow their pace of oilseed purchases or the South American soybean harvest go better than expected, prices will weaken. But if Europe sees another hot, dry summer that limits their rapeseed production, prices could further strengthen. The March contract settled in late January at $717.80 per tonne, marking the first close above the $700 per tonne level since March 2008.
Lentils and peas
Canada’s supply of dry peas in the 20-21 MY is expected to be 6% higher, with 8.4% production growth. Even with increased Chinese imports of Canadian peas, carry out stocks will rise to 450,000 tonnes, according to AAFC. Prices of the current crop year will be higher than the 5-year average but will fall with the arrival of the 2021 crop, pressuring margins. India’s tariffs will continue to limit exports, as will lower demand elsewhere, increasing the 21-22 MY carry out stocks.
Lentil stocks will be higher at the end of the 20-21 MY because of its greater production, placing some pressure on prices for the 21-22 MY. Production growth in other exporting countries will further pressure them. However, trend yields suggest that production won’t grow yoy despite a small rise in seeded acres this spring. Even though prices for the new crop are projected lower yoy, they’ll still support positive margins.
Trends to watch in 2021
Limited supplies, tight stocks-to-use ratios: a recipe for volatility
The quality and volumes of South American crops over the next six months will determine if the high prices at the start of 2021 remain elevated through the North American marketing year. Russia has also added uncertainty to the mix by imposing export quotas to combat high domestic prices on numerous 20-21 MY crops, including wheat.
Export restrictions like these amplify price movements in the short-term, especially given these countries’ respective market shares and when stocks-to-use ratios are low, as they are now. Volatility may spike throughout 2021.In a song about global ag, “China, China” is the chorus
It’s now clear that market fundamentals drive U.S.-China agriculture trade, and not necessarily the hostilities of trade conflicts. In 2021, those fundamentals are tied to China’s hog herd rebuild. African Swine Fever has put a permanent stamp on China’s future hog and pork market structure, with enormous investments being made in pig production sites designed to be the largest in the world. With the shift to major commercial production has come an unrelenting need for feed imports and an increasingly interdependent relationship between the U.S. and China. Measured by the bushel, the U.S.-China relationship has never been stronger.
Despite that, China’s commitment under the terms of the Phase 1 deal with the U.S. was to buy US$36.6 billion worth of ag commodities in 2020, a commitment they didn’t keep. While President Biden is waiting to address any changes to the deal his administration may deem necessary, the China–Australia trade wars continue to escalate. They may grow to include more tariffs applied to Australia’s ag commodities, offering further opportunities to step up North American exports to China.COVID’s hangover: currency fluctuations in a year of economic re-stabilization
It was a roller coaster ride for many currencies in 2020, and the loonie was no exception. The current strength in the Canadian dollar is mostly the result of weakness in the U.S. dollar, which has now lost around 12% from its peak in March 2020 when measured by a trade-weighted index.
A weak U.S. dollar is usually positive for commodity prices as it raises the purchasing power of major importers. But a relatively stronger loonie/weaker USD also hurts Canadian exporters’ competitive advantage and tighten profit margins of farming operations.
U.S. monetary policy is expected to remain very accommodating, and we’ll see low interest rates for the foreseeable future. Those two factors may inhibit growth in the USD. On the other hand, stimulus could lead the U.S. economy to gain strength. It could then revert the weakening trend - and place a ceiling on the strength of the loonie.
Check back on our blog for a regular update of this 2021 field crop outlook and outlooks for the cattle and hog, broiler, dairy, and food processing sectors. An in-depth analysis of interest rates, currencies and GDP will be released in early March.

Martha Roberts
Economics Editor
Martha joined the Economics team in 2013, focusing on research insights about risk and success factors for agricultural producers and agri-businesses. She has 25 years’ experience conducting and communicating quantitative and qualitative research results to industry experts. Martha holds a Master of Sociology degree from Queen’s University in Kingston, Ontario and a Master of Fine Arts degree in non-fiction writing from the University of King’s College.