Top 5 economic trends for Canadian agriculture and food to watch in 2022

A wild ride in 2021 is throwing us into 2022 off-balance and uncertain. Last year wasn’t the year of recovery and respite we thought was imminent after the horror story that was 2020. Instead, we’re left with trends increasingly difficult to forecast. COVID-19 continues to wind itself around virtually every global and domestic economic development, complicating things outright. Weather disasters have wreaked havoc with the transportation of manufacturing inputs and outputs. The world seemingly cannot (or will not) stop demanding rapidly disappearing goods and services. Inflation is unusually high. Canada’s labour market has perhaps sorted itself out overall, but pockets of great uncertainty remain.
For these reasons, we’re suggesting those in Canada’s agriculture and food sectors monitor the following five trends in 2022. We’ve suggested charts to make that easier: inflation and future interest rate changes (the yield curve), ongoing supply chain woes (Baltic Dry Index), labour shortages (Beveridge Curve in food processing), supply-demand imbalances (stocks-to-use ratios), and strength in demand for meat amid inflation (the FCC Meat Demand Index).
1. Inflation, inflation, inflation
Inflation is our first trend to monitor in 2022 as it underlies each of the other four trends. Because the bond market conveys expectations about future inflation, we’re monitoring changes in the yield curve to assess inflationary pressures.
Figure 1: Changes in the yield curve reflect economic volatility produced by COVID

Pre-pandemic, the yield curve suggested Canada was headed for weak economic growth, then COVID-19 triggered the worst Canadian recession since the Great Depression. The Bank of Canada (BoC) cut its prime rate and began a program of quantitative easing.
One result of the economy ramping up from the initial shock in 2020 was rising inflation. That was a good thing: prices had fallen but then recovered. They’ve continued rising, with inflation now expected to be above the Bank’s target rate for most of 2022.
Short-term bond yields have climbed in line with expectations for the BoC to increase its policy rate by at least 100 basis points in 2022. But long-term bond yields have retreated from the highs of late November, suggesting markets aren’t overly concerned about inflation accelerating and requiring further rate hikes. And while persistent supply chain disruptions and global demand will prompt higher prices of virtually everything and supply shortages may continue for some key commodities, pressures on oil, gas and global ag commodity supplies are expected to weaken. Of course, the biggest unknown right now is omicron threatening the progress in unlocking supply chains.
Risk to manage: Financial
Interest rates are likely to rise in 2022. Now’s the time to prepare by locking in rates to take advantage of an historically low interest rate environment.
2. Time, the tides and shipping costs wait for nobody
Throughout the pandemic, supply chain disruptions caused by shortages and backlogs in global transport networks have only added to increasing inflationary pressures.
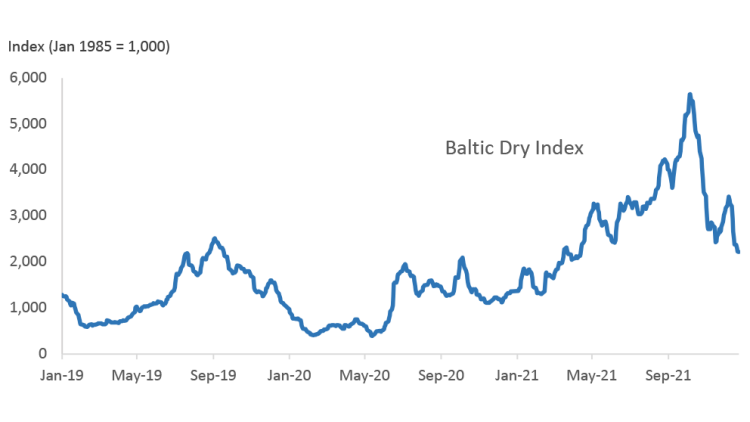
There’s no better indicator of shipping constraints and costs than the Baltic Dry Index (BDI). The index records average prices paid for the transport of dry bulk materials across more than 20 global routes. It’s often viewed as a leading indicator of economic activity as index movements reflect supply and demand for important materials used in manufacturing.
Figure 2 shows the constraints imposed shortly after the pandemic was declared. Average monthly costs rose 5.8% month-over-month (MoM) in 2019 and 7.3% in 2020. Then, in 2021, an average 15.3% MoM increase signalled the sharp rise in the number of constraints and the depth of the supply/demand imbalance each constraint suggested.
Figure 2: BDI records meteoric rise in 2021 but has fallen recently

Source: Blooomberg
We’ll monitor the index’s return to pre-covid levels, although there may be little relief until the second half of 2022. A shortage of shipping containers and truckers and the infamous semiconductor chip crunch limiting new truck production are all expected to limit supply growth. At the same time, importers’ demand for raw agricultural commodities and other manufacturing inputs is expected to remain high.
3. Stocks-to-use ratios for wheat, soybeans expected to balance out in 2022
Drought conditions, extreme weather events and surging demand since 2019 have contributed to recent global supply/demand imbalances for several major crops. In Canada, last year’s drought reduced Canadian stocks-to-use ratios to lows not seen in years. Not even the price spikes produced by record demand curbed trade of raw commodities worldwide throughout 2020 and 2021.
Stocks-to-use ratios provide an excellent measure of the balances on which commodity prices depend. Global production outcomes varied considerably in the 2021-22 crop year. North American wheat production was reduced by drought, but European production was up 9.0% YoY. Winter South American and U.S. wheat production will boost supplies further but only if La Nina threats weaken. While there are larger global supplies of soybeans (Figure 3), high quality wheat is still in short supply.
Figure 3: Canadian production shortfalls in 2021 deplete world stocks-to-use ratios of canola, barley

Sources: Statistics Canada, USDA PSD
We’ll monitor these ratios for Canada and the world throughout 2022, focusing on seeding decisions and production progress for the 2022-23 crop year. Canadian ratios for wheat, barley, and canola are well below their respective 10-year averages. That matters the most to global supplies of canola and barley, given Canada’s dominance in the production of both. But because global wheat and soybean stocks aren’t tight, strong demand is needed to keep prices high through this marketing year and next.
Risk to manage: Marketing
Commodity prices are generally high right now, and for those with 2021 crops to sell, look for possible reversals in price trends to determine if making sales earlier rather than later is optimal. Keep an eye on South American production progress over the winter to understand how they’ll impact stocks-to-use ratios and expected prices.
4. COVID further complicates food processors’ labour challenges
Food processing’s labour challenges are now chronic. At the start of 2022, more workers are employed in food manufacturing than before COVID, but businesses still can’t keep up with demand. Unfilled orders are trending up 50% YoY. The latest job vacancy report (from 2021 Q3) was at 6.0%, up from 3.9% during the same period in 2019 and up from 2.7% in 2016. Year-to-date average wages excluding overtime are up 4.4%. Even record-high production per employee hasn’t offset higher costs.
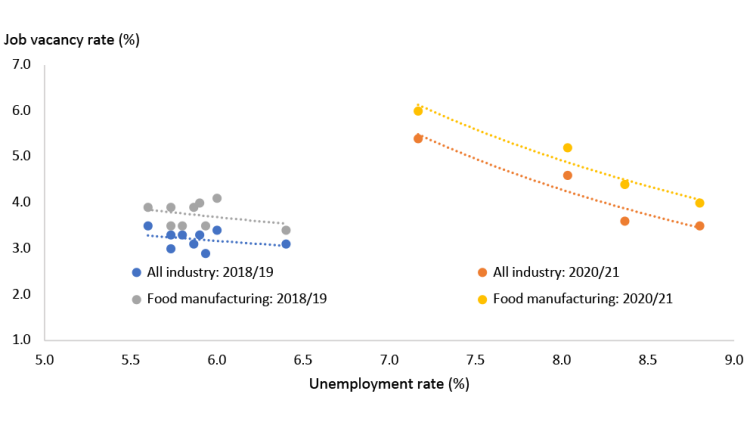
The Beveridge Curve illustrates the gaps between unemployment and job vacancies (Figure 4). Its typical slope is based on the hypothesis that, with fewer jobs available, more people will be out of work (and vice versa).
Figure 4: COVID-19 heightens Canadian food processing’s labour shortages

Source: Statistics Canada
Major market interruptions such as COVID are expected to shift the curve right, indicating the start of a new business cycle with a noticeable jump in the unemployment rate (as shown in Figure 4 for overall manufacturing and food processing). Economic crises disrupt the labour market resulting in structural mismatches between available jobs and unemployed workers.
The two splits indicate the labour market for food processing firms is tighter than in the overall economy: the vacancy rate at any level of unemployment is higher in food processing than for all industries. We'll be watching if the vacancy rate in food processing grows or shrinks and if the labour market can match workers with employers (i.e., a shift of the Beveridge curve back to the left) in 2022.
Risk to manage: Human Resources
A labour strategy is key for food processors right now. How can you recruit, onboard and train, and importantly, retain employees in a period of scarcity and high competition for workers?
5. COVID-19 casts long shadow on Canadian meat demand
Animal proteins weren’t immune to the inflationary pressures seen elsewhere. We normally have a good sense of how meat consumption patterns respond to economic fluctuations. As incomes fall or prices rise (both of which happened after the first several months of the pandemic), we expect meat consumption to decline as households cut back on more expensive meals. The recurring lockdowns and foodservice closures also curtailed meat consumption. The pandemic has clearly impacted consumption (consumer purchases) and demand (consumer preferences).
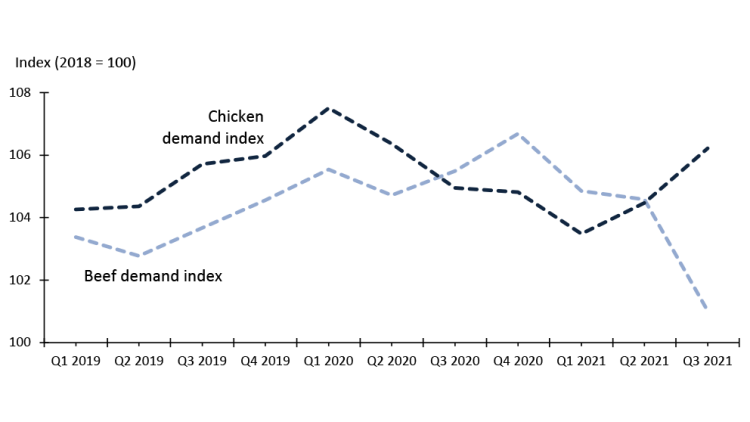
Demand for chicken declined at the start of 2020, as consumers struggled with the pandemic’s job and income losses and food service shutdowns (Figure 5). But while chicken demand fell throughout 2020, beef demand took a small initial plunge in 2020 Q1, then rose steadily until the end of the year.
Figure 5: Consumer demand for meat shifted throughout pandemic

Sources: Statistics Canada, AAFC, Canfax, University of Guelph, FCC calculations
Patterns in chicken demand and consumption (i.e., actual purchases – not shown) have been a strong match. Chicken demand rebounded in 2021 in response to widespread foodservice re-openings and perhaps higher red meat prices inducing substitution away from red meats. With global demand for red meat strong in 2021 and elevated prices (December YoY retail beef inflation was 15.4%), Canadians’ purchases of, and preference for, beef have waned – the beef consumption index peaked in 2020.
Throughout 2022, we’ll be watching closely to see if the demand indices return to their pre-pandemic level and resume their growth. Business conditions for the foodservice sector and inflation will likely be major influences.

Martha Roberts
Economics Editor
Martha joined the Economics team in 2013, focusing on research insights about risk and success factors for agricultural producers and agri-businesses. She has 25 years’ experience conducting and communicating quantitative and qualitative research results to industry experts. Martha holds a Master of Sociology degree from Queen’s University in Kingston, Ontario and a Master of Fine Arts degree in non-fiction writing from the University of King’s College.