Food inflation and higher input costs for farms and food processors: Is there a link?

This is the first of two posts looking at agri-food price transmission, or the effect of farmers’ input prices on the prices that food processors receive for pork and dairy products.
In an environment of high and volatile commodity prices, it’s fair to ask how much of an increase in the price of making bacon can be traced back to the cost of fertilizer used to grow the grains used to feed the pigs that make the bacon. In this post, we look at one important link in the supply chain – that of ag producer-to-food processor – to understand the inflationary pressures on price transmission from the farm gate to the manufacturing gate.
Inflation a global phenomenon
Food prices, and how much higher they are now, is a global story. The September Consumer Price Index (CPI) shows that food experienced a 10.3% year-over-year (YoY) increase in 2022, in no small part due to COVID-19’s lingering influence on demand and supply. As the pandemic has worn on, pent-up demand has raised commodity prices sky-high in some cases, with supplies made worse by supply-side shocks such as severe weather and geopolitical turmoil.
At the farm level, input costs have ballooned since 2019. Obvious questions relate to the transmissibility of costs from the farm gate through the supply chain to the processors who turn the commodity into food. How much of those farm-level costs are passed on? Are they passed on quickly, i.e., when they’re incurred, or is there a lag? What additional cost increases are applied at the manufacturing level, and how have those trended?
Price transmission refers to the effect of prices in one market on the prices of another.
This analysis relies on data from three Statistics Canada datasets.
The Farm Product Price Index (FPPI) measures the prices Canadian farmers receive from the sale of agricultural products.
The Raw Materials Price Index (RMPI) measures price changes for raw materials purchased for further processing by manufacturers operating in Canada.
The Industrial Product Price Index (IPPI) measures price changes for products sold by manufacturers operating in Canada.
A sharp increase in ag’s costs of production since 2019
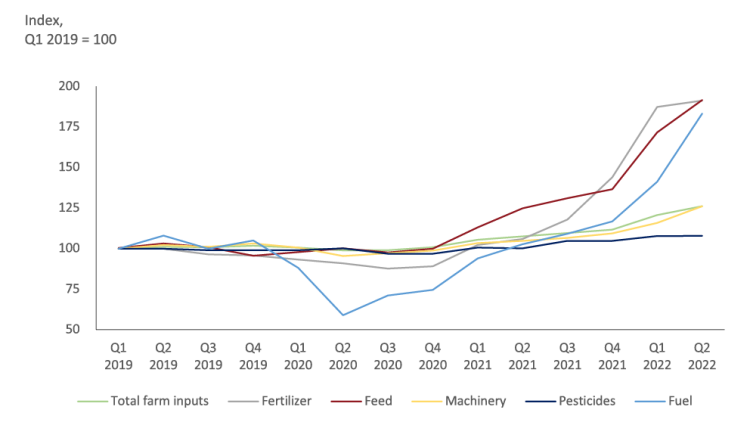
Figure 1 shows the steep cost increase at the overall farm level between 2019 and 2022. Although all major categories of farm input costs have become more expensive over the last 3.5 years, feed, fuel and fertilizer costs have exploded.
Figure 1: Feed, fuel and fertilizers top inflation index
Source: CANSIM Farm Input Price Index - Table 18-10-0258
As of June 2022, fuel costs had increased more than 80% since the first quarter of 2019, while average fertilizer and feed costs had come very close to doubling, with some fertilizer types more than doubled. While they didn’t reach the same highs, machinery and pesticide costs have also risen, leading to overall farm input growth of 25%. And as of September 2022, the cost of farm labour (not shown) had increased almost 13% from January 2019 levels.
At the processing level, the prices manufacturers pay for raw materials have gone up, along with other costs. According to Industry Canada Financial Performance data, raw material purchases and sub-contracts in dairy processing (for businesses with revenues <$20M) accounted for nearly 60% of revenues in 2020. Total wages (salaried and hourly) have increased by 10.6%, on average, annually between 2019 and 2022.
In this post, we look at the extent to which the inflationary pressures of farm inputs (grain prices) are transmitted through the manufacturing used to turn unprocessed milk into dairy products and lean hogs into pork products.
Price transmission in a supply-managed supply chain
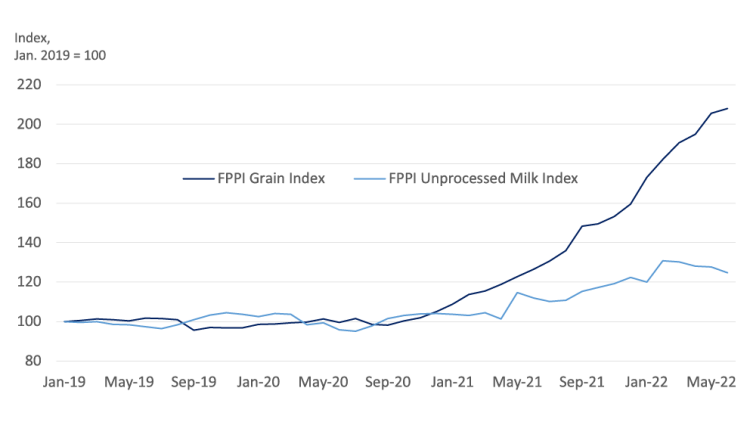
In 2022, processors are paying dairy producers more for unprocessed milk components than in early 2019, and much of that is captured in the transmission of the sharp increase in feed prices. Growth in the Farm Product Price Index (FPPI) prices paid for grain is highly correlated (94%) with movement in the FPPI Unprocessed Milk Index, so it’s not surprising that another hike in milk prices has been set for February 2023, with expenses continuing to creep up.
Figure 2 shows the low volatility of grain prices throughout 2019 and most of 2020, then the tremendous price movement in 2021, which continued in the first half of 2022.
Figure 2: Inflation in dairy feed costs shows up in unprocessed milk prices
Source: Statistics Canada. Table 32-10-0098-01 Farm product price index (FPPI), monthly
However, the higher grain prices shouldn’t generate the same inflationary measures for raw milk at the farm or processing levels. Their impact depends on their proportion of total costs: in dairy, feed costs represent roughly one-quarter of total costs (unindexed). Because inputs other than grains are used in raw milk production at the farm level (as illustrated in Figure 1), each of which is subject to its inflationary pressures, the steepest grain price inflation was only mimicked with an inflationary trend in milk prices.
Nonetheless, the last 12 months have been difficult because, in addition to rising grain prices, other costs of production have also risen. According to the Canadian Dairy Commission and indexed to June 2022, dairy’s feed rationing has climbed 22% since 2021, fuel and oil by 66%, and fertilizer and herbicides by 35%. Machinery and equipment repairs and other miscellaneous costs have also increased.
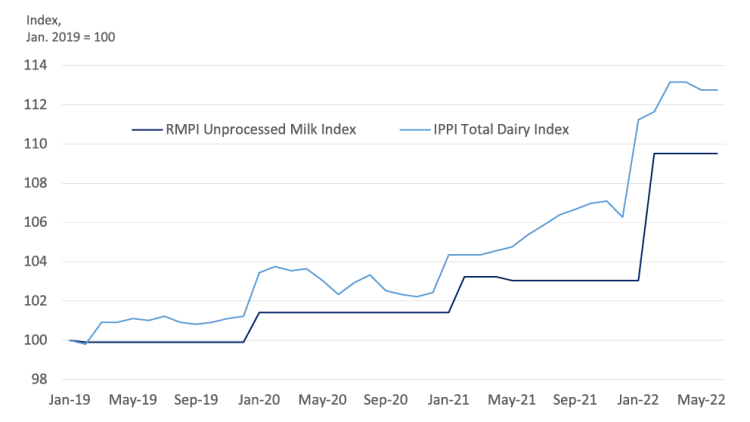
Figure 3: Higher raw milk price correlates with higher industrial dairy product prices
Sources: Statistics Canada. Table 18-10-0268-01 Raw materials price index, monthly, Statistics Canada. Table 18-10-0266-01 Industrial product price index, by product, monthly.
Dairy product manufacturers have faced significant inflation pressures too. Record job vacancies in food manufacturing pushed weekly employee earnings (excluding OT) up 14.2% YoY in August. Energy, buildings and other materials saw significant growth. As a result, the Industrial Product Price Index (IPPI) increased 13% since January 2019 (Figure 3). Increases in the price of the milk they purchase are strongly correlated (94%) with the movement in the prices they receive for processed dairy products.
Price transmission in the hog sector’s supply chain
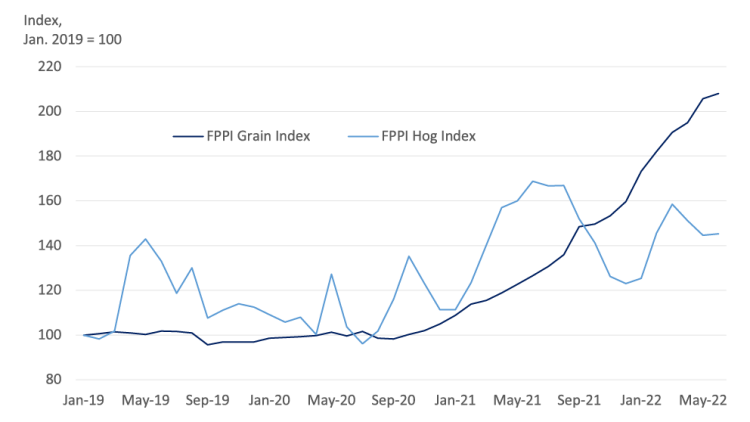
At the farm level, higher grain prices are the same for supply-managed and non-managed sectors. But because the hog sector experiences more volatility in the prices received for live swine, movement in those prices is only moderately correlated (57%) with movement in feed costs (Figure 4).
Figure 4: Hog prices show more volatility than grain prices
Sources: Statistics Canada. Table 32-10-0098-01 Farm product price index (FPPI), monthly
Between January 2019 and October 2021, even the biggest downward swings in hog prices still managed to mostly stay above the small but rising inflationary pressures in grain prices. And as grain prices rose, the hog price moved largely in tandem, albeit with more volatility, until October, when grain prices continued to rise, and hog prices fell. Since then, the upward trend in feed costs has outpaced the movement in hog prices.
Feed costs account for the largest proportion of the hog sector’s costs of production. FCC Economics’ modelling suggests that as feed costs have risen, they’ve taken up an ever-increasing share of the overall cost of hog production. In 2019, they were 60.8% of total costs; in 2022, they’ve grown to account for 65.5% of total costs, while total costs have also risen.
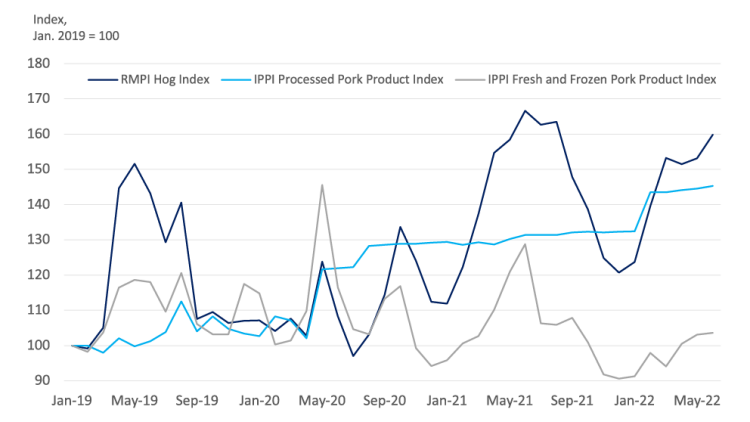
The general trend in the movement of the prices paid to hog producers is reflected in the movement of prices received for both processed pork (e.g., ham and bacon) and fresh and frozen pork (Figure 5).
Figure 5: Inflation trends in the hog/pork supply chain often diverge
Sources: Statistics Canada. Table 18-10-0268-01 Raw materials price index, monthly, Statistics Canada. Table 18-10-0266-01 Industrial product price index, by product, monthly.
The RMPI Hog Index correlates moderately (54%) with the IPPI Processed Pork Product Index and weakly (22%) with the IPPI Fresh and Frozen Pork Product Index. Throughout most of 2019 and between March and November 2021, the inflation in live hog prices easily exceeded the inflation in processed, fresh, and frozen pork. However, there have been several times (e.g., between May 2020 and March 2021) when the IPPI for processed pork inflation exceeded the inflation in the RMPI.
Bottom line
Inflation in labour and input costs, primarily feed, fuel and fertilizer, have shown up in prices paid further along the supply chains. But they do so inconsistently, especially when compared between supply-managed and non-managed sectors. In an era defined by high inflation, it’s a reminder that price transmission is complex and subject to multiple influences.
Check back next week for an explanation of the drivers of price transmission in Canada’s agri-food supply chains.

Martha Roberts
Economics Editor
Martha joined the Economics team in 2013, focusing on research insights about risk and success factors for agricultural producers and agri-businesses. She has 25 years’ experience conducting and communicating quantitative and qualitative research results to industry experts. Martha holds a Master of Sociology degree from Queen’s University in Kingston, Ontario and a Master of Fine Arts degree in non-fiction writing from the University of King’s College.