2021 top economic trends: Export risks and opportunities for grains, oilseeds and pulses

Following the massive setback of an estimated 4.2% global economic contraction in 2020 due to COVID-19, 2021 will likely see a rebound of similar proportions. Although any misstep, whether in new outbreaks or vaccine rollouts, will cast a long shadow of doubt on economic growth this year, a successful defence against the virus may boost global per capita incomes. The big question remains how the health and economic fallouts from COVID-19 will intersect with climate change and geopolitical tensions to impact agricultural production and trade this year.
Last week, we described the influence of those three forces on Canadian red meat sectors. This post looks how these forces may alter global markets for oilseeds, pulses, and wheat.
COVID and the world’s net crop importers: where the virus’ power ends
Many countries can’t grow enough staple crops to meet their domestic consumption needs. Japan, for instance, has a large population and tiny land resources. China has much more land but a massive population. The green and purple bubbles in the figures below (lower-income and higher-income countries, respectively, above the red line) highlight some of Canada’s best global opportunities. These represent net importers – countries that consume more than they produce.
As a net exporter, Canada produces more major field crops than we consume as food, feed or fuel. That means opportunities for Canada as a trusted, reliable supplier of high-quality crops in 2021 – opportunities to meet the needs of net importers that even a virulent virus isn’t likely to diminish.
Consumption and production – or how exports are made
The location of each bubble in the charts below is based on their supply and demand factors in 2019. The consumption/production (CP) ratio is consumption volumes/ production volumes. Because those factors will change in 2021 due to any combination of COVID, climate change and geopolitical tensions (amid other lesser forces), the bubbles’ locations may also change.
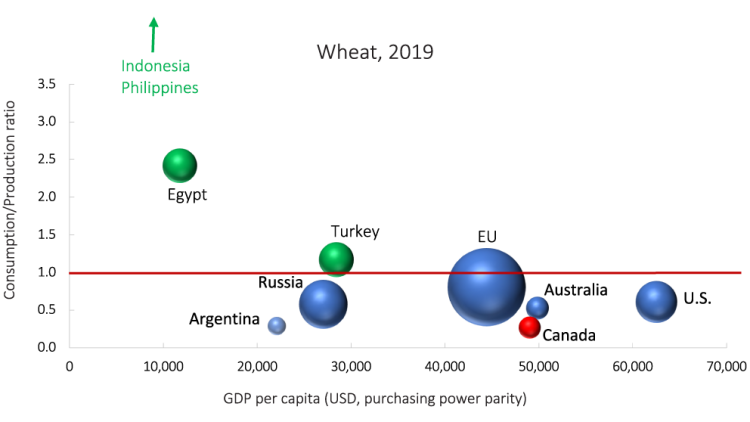
Figure 1: Wheat markets with potential to grow are also facing strong recessionary pressures

Sources: UN Comtrade, World Bank OECD and FCC calculations. The chart depicts wheat production, consumption and GDP in 2019. Net wheat importers have C/P scores > 1 (above the red line). Net exporters have scores < 1 (below the red line). Consumption (volumes) provides the size of bubble for each country. Countries in green are emerging economies; blue denotes competitors. The chart includes the top 5 importers and/or exporters of wheat, with the EU (28) selected instead of individual member countries. Canada is always included, even if not in the top 5.
With the lowest C/P ratio of all the selected countries (Figure 1), Canada had the most wheat proportion to our total production to export. The EU and Russia dominated the market among the net exporters.
Among the net importers, Indonesia and Philippines, whose consumption of wheat was roughly half that of either Egypt or Turkey, nonetheless relied exclusively on imports to meet their needs. With C/P scores well above the others, they couldn't be shown in Figure 1.
As food prices rise globally, some of the countries we’ve shown here are taking direct steps to bring stability to their domestic markets. The Russian government will impose grain export quotas and an export tax on wheat this spring to lower rising food prices. Argentina is suspending corn exports until March 1, looking to control food inflation. The last couple of years easily illustrated how trade disruptions can introduce detrimental volatility in ag commodity markets.
Keep an eye on our competitors – Australia and Russia may look to sustain high wheat production volumes recorded in 2020, while the EU and U.S. look to rebound.
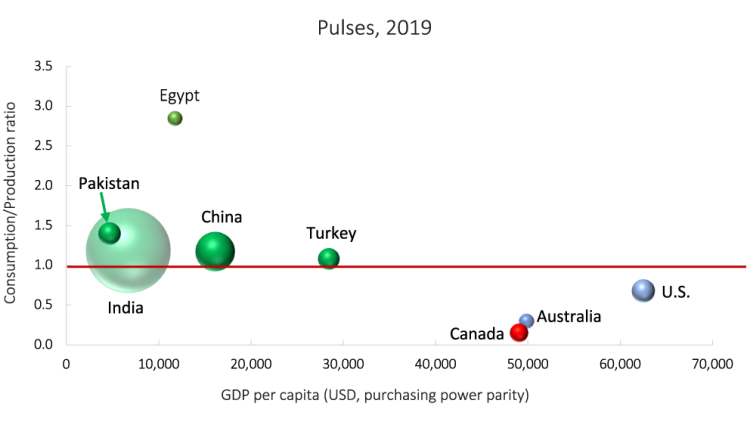
Figure 2: Stark contrast between net importers and exporters reveals dilemma facing Canadian exporters

Sources: UN Comtrade, World Bank OECD and FCC calculations. The chart depicts pulse production, consumption and GDP in 2019. Net pulse importers have C/P scores > 1 (above the red line). Net exporters have scores < 1 (below the red line). Consumption (volumes) provides the size of bubble for each country. Countries in green are emerging economies; blue denotes competitors. The chart includes the top 5 importers and/or exporters of pulses, with the EU (28) selected instead of individual member countries. Canada is always included, even if not in the top 5.
Canada is a major supplier of global pulses. Figure 2 shows a marked distinction between net importers and exporters of pulses. It’s a pattern cleanly delineated by wealth that isn’t reflected in either wheat or canola markets. Does that expose Canadian producers to greater risk? Once again, they held the lowest C/P ratio of all the selected countries with the largest proportion of our pulse production to export. India dominated the net importers, with China the distant second-largest consumer. Egypt produced very little of the pulses it consumes, but it also consumes very little.
While 2021 world production is expected to increase, each net importer shown here is likely to remain a net importer. India will continue to bear disproportionate weight in global pulse markets.
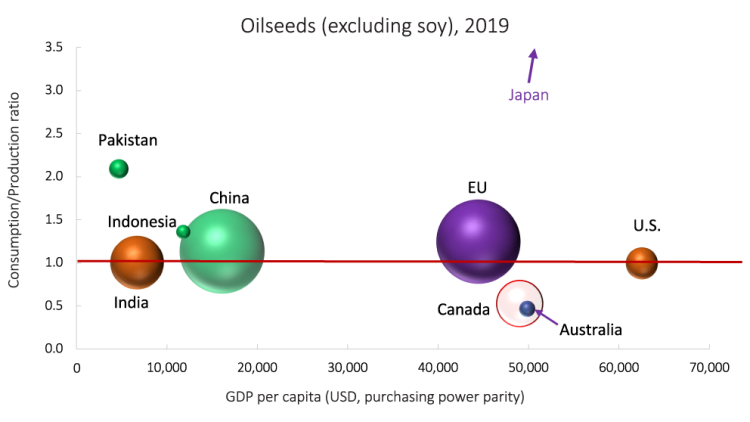
Figure 3: Smaller canola markets show the greatest diversification

Sources: UN Comtrade, World Bank OECD and FCC calculations. The chart depicts oilseed production, consumption and GDP in 2019. Net oilseed importers have C/P scores > 1 (above the red line). Net exporters have scores < 1 (below the red line). Consumption (volumes) provides the size of bubble for each country. Countries in green are emerging economies; purple represents wealthier economies; orange denotes net zero importers and blue denotes competitors. The chart includes the top 5 importers and/or exporters of oilseeds, with the EU (28) selected instead of individual member countries. Canada is always included, even if not in the top 5.
Roughly half of Canada’s total production of canola was used domestically (Figure 3). China and the EU easily surpassed Canadian production, but each also consumed much more than Canada in 2019. India, a global leader in canola consumption, and the U.S. were net zero producers: they consumed as much as they produced and no more.
Why it matters
COVID-19 produced the lion’s share of 2020’s global recession, the deepest in decades. Per capita income growth is expected to have been hit hard, particularly in emerging and developing countries. Many of these have been and will continue to be net importers of ag commodities and food, raising the spectre of growing food insecurity and more optimistically, the opportunity to supply those needs.
Nonetheless, Canadian exporters depend on importers’ healthy populations and economies. While the post-pandemic era will offer unknown bonanzas to those who can foresee future needs, labour markets worldwide are still struggling to adapt to a new reality that has seen millions of jobs erased. The Great Reset has been imagined, in part, to acknowledge that millions of people have risked their lives to go to work so that millions of others may stay at home. We have yet to determine how COVID has already and will continue to impact individual countries’ GDP per capita growth and the consumption/production ratio shown in each figure above. However, we do know global recovery is taking the form of a “K”, not a more uniform and less worrying “V”. It is thereby shifting the patterns in demand for food domestically and abroad.
That’s a serious challenge and it’s occurring within the context of climate change. Both the large weather events and the incremental creep in sea levels and temperatures that the change produces will both enhance and reduce production opportunities in 2021.
Some of the greatest threats posed by climate change are in emerging markets like China, India and Indonesia - the markets Canadian crop exporters look to for growth. They’re often more precariously situated to rising sea levels and moisture anomalies. It’s hard to say exactly where climate changes will impact agriculture in 2021. But the drain on GDP growth per capita it will produce, combined with shocks from COVID-19, will eat away at the health of all economies, and emerging and developing economies especially.

Martha Roberts
Economics Editor
Martha joined the Economics team in 2013, focusing on research insights about risk and success factors for agricultural producers and agri-businesses. She has 25 years’ experience conducting and communicating quantitative and qualitative research results to industry experts. Martha holds a Master of Sociology degree from Queen’s University in Kingston, Ontario and a Master of Fine Arts degree in non-fiction writing from the University of King’s College.