Deteriorating farmland affordability presents challenges

Despite Canadian agriculture facing challenges in 2023 such as commodity prices declining, elevated input costs and interest rates, and severe weather events, farm cash receipts ultimately grew 3.6%, to a new record of $98.6 billion. With the availability of farmland for sale remaining tight, average farmland values increased 11.5% in 2023, down from the 12.8% in 2022.
Farmland prices across Canada have experienced strong growth over the last decade (2014 – 2023), up 9.1% on average annually. Farmland value increases differed among regions, with eastern Canada experiencing higher average annual growth rate of 9.9%, compared to Western Canada averaging 8.0%. Rising farmland values leads to discussion on affordability of newly purchased farmland. Affordability of farmland is influenced by a range of factors, including land prices, interest rates, farm income, urban population, and farmland supply.
This post introduces and estimates a farmland affordability index. While important nuances exist across provinces, farmland affordability deteriorated to its worst level in 30 years at the end of 2023 as farmland values and mortgage rates increased. We also explore reasons why land prices continued to appreciate in 2023 amid a rising interest rate environment.
Defining and measuring farm affordability index
The farmland affordability index (FAI) is a ratio of farmland purchase related costs (annual payments on newly purchased farmland) to the income potential from the land. This ratio is indexed to 2020 as the base year, to compare the development before and after the pandemic. The higher the ratio, the less affordable it is to purchase farmland as a greater share of revenue is needed to service debt.
Using the Bank of Canada’s housing affordability index as a guide, we expressed FAI as follows:
Assuming a land purchase with a down payment of 25% and a loan amortized over 25 years, the annual repayment (principal and interest) will be based on the mortgage interest rate and principal loan amount. The denominator i.e., returns on each acre of land, is measured by using farm cash receipts divided by the number of seeded acres.
Why is this index important?
For most farm businesses, farmland is the most valuable revenue generating asset. Trends in farmland prices are a major driver of financial performance and business growth over time. FCC’s new index can be used to track the development of Canadian farmland affordability over time, and provide valuable insights into Canadian farmland prices, to ensure farming businesses can make informed business decisions on their farmland assets and investments.
Highlights of the index
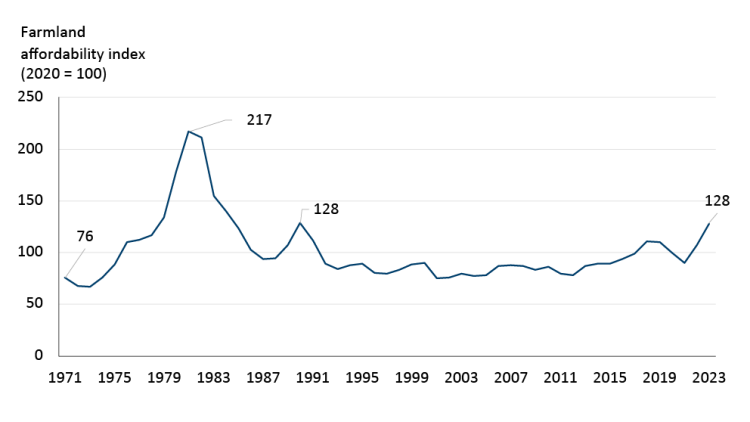
Farmland affordability reached its historical worst in 1981 as five-year mortgage rates hit 18% in addition to production and price challenges that impacted farm cash receipts. The general decline in interest rates from the mid-1980’s to the early 2000’s improved farmland affordability and kept it relatively steady. However, the surge in rates and strong appreciation of farmland values since 2020 have caused farmland affordability to deteriorate to its worst level since 1990 (Figure 1).
Figure 1: Farm affordability in Canada the worst in over three decades
Sources: Statistics Canada, FCC Calculations
A rising FAI (deteriorating farmland affordability) indicates that farmland values are outpacing revenue generated from farmland. While rising farmland values mean established farmers will have more equity from their assets, they also indicate that the price of farmland has become elevated compared to the revenue that can be generated from it.
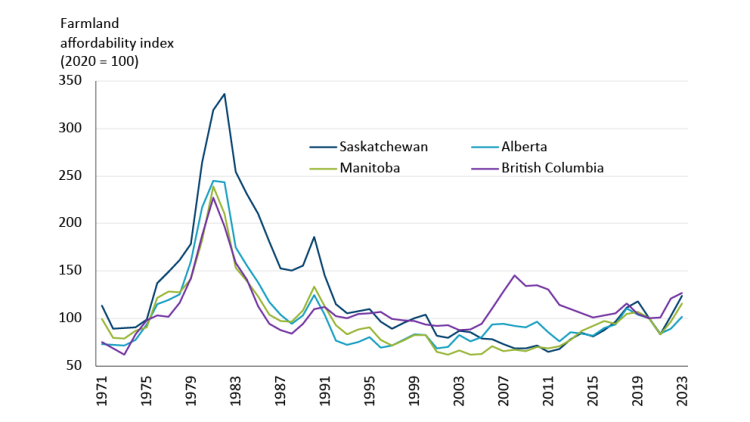
In western Canada, the impact on rising farmland values and interest rate hikes has elevated the FAI to a decade high. Since 2020, British Columbia has experienced the most significant deterioration, due to higher farmland values. Alberta saw the least deterioration over the same period, partly due to slower appreciation of farmland values over the same period (Figure 2).
Figure 2: Farm affordability index in Western Canada shows deterioration in recent years
Sources: Statistics Canada, FCC Calculations
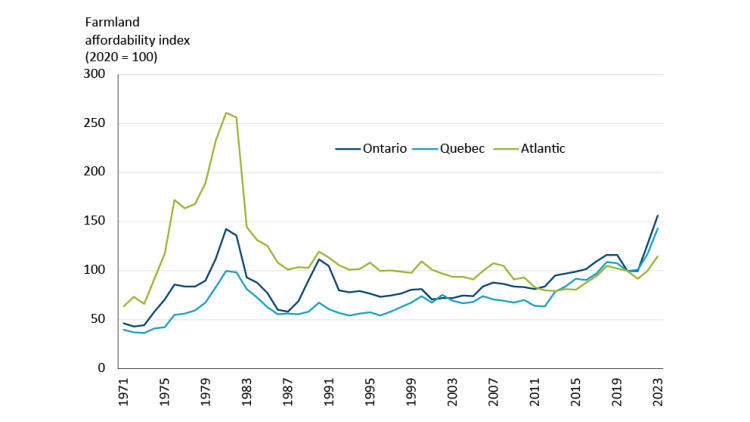
Farmland affordability has deteriorated to unprecedented levels in Eastern Canada, with Ontario in 2023 breaching 1981’s previous record for the least affordable land as farmland values appreciated faster than the growth in farm cash receipts (Figure 3). Quebec set an all-time worst in 2022 with further declines in 2023.
Figure 3: Farm affordability index in Eastern Canada shows deterioration in recent years
Sources: Statistics Canada, FCC Calculations
Why did farmland values keep going up in 2023?
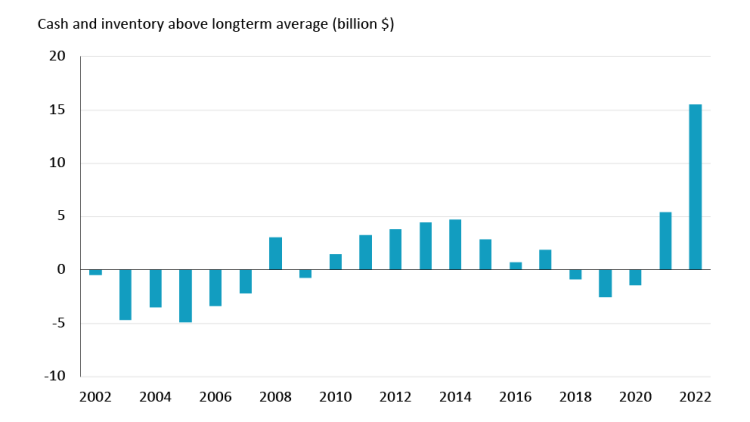
The current ratio, which is the amount of cash and inventory divided by current liabilities, indicates the available cash that an operation has readily available. Historically, Canadian farmers kept 2.5 times the cash and inventory value of current liabilities. At the end of 2022 however, Canadian farmers held 3.4 times, or the equivalent of $15.5B more than required to meet their short term credit obligations. The higher level of cash available to farm operations allowed producers to invest in farmland despite the higher interest rate environment.
Figure 4: Higher than average cash and inventory was held by producers at the end of 2022, equivalent to $15.5B
Sources: Statistics Canada, FCC Calculations
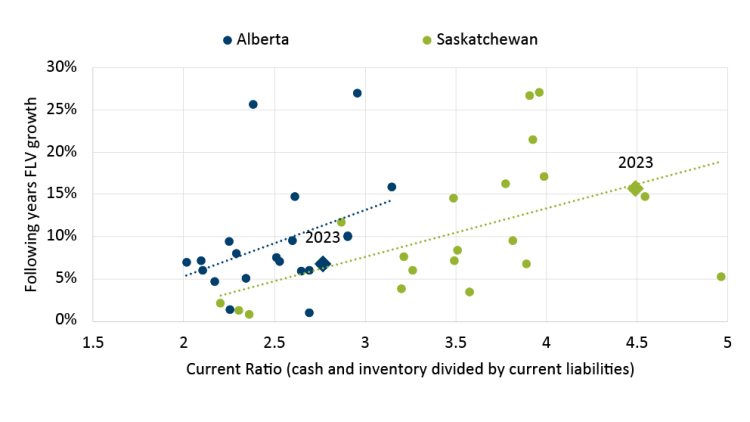
Producers in provinces that held higher cash reserves at the end of 2022 should be in a better position to purchase farmland in 2023. In the prairies, Saskatchewan producers were sitting on a near record current ratio and led Canada’s FLV growth. Alberta, meanwhile, after a few years of challenging weather had less excess cash and inventory, which limited FLV growth.
Figure 5: Current ratio for Alberta and Saskatchewan were strong in 2022, but other factors still impact FLV growth
Sources: Statistics Canada, FCC Calculations
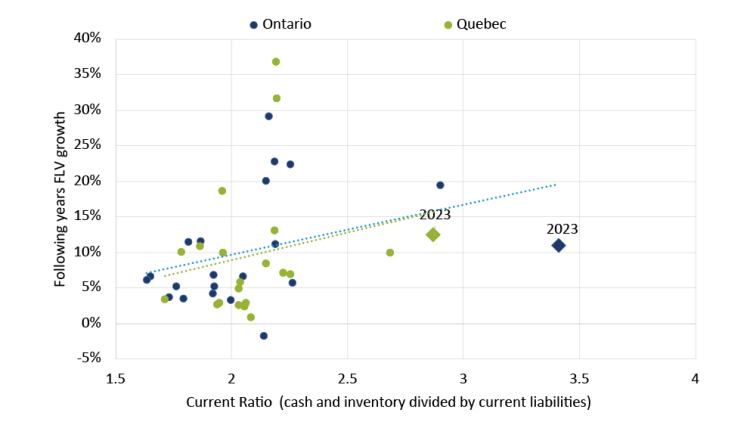
Ontario and Quebec producers both held a record current ratio at the end of 2022. Strong working capital positions may contribute to some operations’ ability to expand their land base and drive farmland affordability lower.
Figure 6: Record current ratios at end of 2022 by producers in Ontario and Quebec
Sources: Statistics Canada, FCC Calculations
What will drive farmland affordability in 2024
Farmland values are expected to remain strong, as farmland supply continues to be tight. With farm cash receipts projected to decline 3.2% due in part to declining prices and lower marketings, and interest rates likely to remain elevated (despite anticipated cuts by the Bank of Canada in the second half of the year), FAI is expected to deteriorate further in 2024. FCC Economics will monitor its development and provide periodic updates during the year.
Article by:
Isaac Kwarteng, Senior Economist
Justin Shepherd, Senior Economist
