Canada’s unsung exports: A look at the trade performance of products we usually skip

We spend most of our time discussing the most economically important ag commodities and food items for which data are readily available. But there’s a whole raft of ag, food and manufactured goods we usually skip. This post addresses the oversight, because these bypassed commodities and products contribute significantly to Canada’s strong overall export trade performance. In 2021, the Harmonized System (HS) codes we selected for this analysis accounted for over $31 billion.
Raw ag commodities
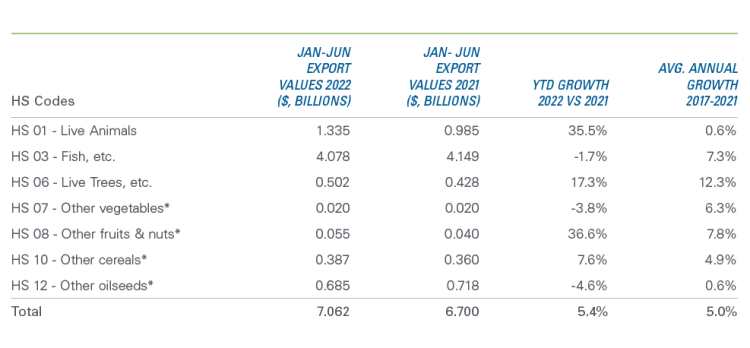
In 2021, Canada’s single-largest ag commodity exports were wheat (HS1001) at $8.3 billion and canola (HS1205) at $6.4 billion. Total exports of ag commodities (includes HS01, 03, 06 – 08, 10, 12) summed to $49.7 billion. Less-often reported ag products account for significant export revenues (Table 1). All product categories show positive average growth between 2017-2021. The pace of exports in 2022 is impressive as YTD exports are 5.4% larger than at the same time last year. One notable exception is for exports of HS03 (seafood). The YTD pace shows a decline of 1.7%, opposite significant growth that averaged 7.3% annually between 2017-2021.
Table 1: Strong export growth over the last five years in ag commodities

Source: Statistics Canada Trade Data Online
* HS07 Other vegetables” includes HS0711, 0712 and 0714; “HS08 Other fruits and nuts” includes HS0801 – 0807 and 0812 – 0814; HS10 Other cereals” includes HS1002, 1004, 1006 and 1008; “HS12 Other oilseeds” includes HS1202, 1204, 1206 – 1214.
Food products
Canada’s food exports (HS02, 04, 05, 09, 11-13, 15-23, 41) totaled $42.9 billion in 2021. Our largest food exports — fresh, frozen and chilled beef and pork — accounted for $8 billion. Another $4 billion came from exports of HS23 (Residues and waste of the food industries) and $1.3 billion from offal and pig fat. The U.S., Japan and Mexico were the three largest markets for Canada’s offal and pig fat, with the U.S. taking almost half of those exports. The U.S. and China account for $3.3 billion of the $4 billion HS23 exports.
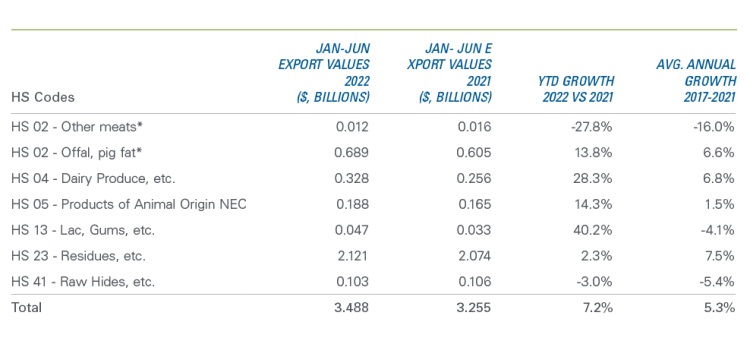
Averaging over half a billion dollars between 2016 and 2020, annual dairy product exports grew yearly between 2016 and 2020, then dipped in 2021 with YoY -17.0% growth. But 2022 YTD pace of exports rebounded at 28.3% (Table 2). Most other categories show strong YTD performance in 2022. HS23 also saw continuous growth between 2015 and 2021, yet growth in 2022 is smaller YTD than its 5-year average. Only the smaller categories “other meats” and “raw hides” lag 2021’s pace, a trend observed for multiple years. Exports of other meats (lamb and horse) from HS02 and raw hides (HS41) declined significantly, with meat falling 64.9% in total from 2015 to 2021 and hides falling 42.6%.
Table 2: Exports of residues and waste from food industries lead growth in food categories

Source: Statistics Canada Trade Data Online
* “HS02 Other meats” includes HS0204, 0205; “HS02 Offal, pig fat” includes 0206 – 0210
Other manufactured agri-food exports
Canada is one of the world’s largest exporters of fertilizers, with our potash exports (HS3104 worth $7.1 billion, or 85.5% of total Canadian fertilizer exports in 2021) going to 47 countries. Canada is the world’s largest potash exporter, supplying almost one-third of the world’s traded potash. Total Canadian fertilizer exports in 2021 accounted for $8.3 billion, followed by a distant second-place category of farm machinery and equipment, worth $2.5 billion.
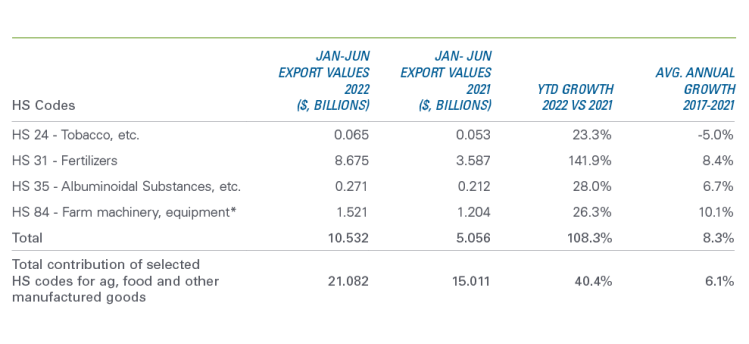
Exports of farm machinery and equipment have grown yearly since 2016, averaging 10.1% per annum — the highest growth rate of all other manufactured goods exports — thanks to a 19.7% YoY bump in 2021 due to ongoing issues with unpredictable supply shortages. The pace of exports in 2022 is encouraging, with YTD exports 26.3% higher than last year. Fertilizer exports are more than 140% higher YTD as prices skyrocketed with the war in Ukraine.
Table 3: Non-food and non-ag commodities contributed more than $10 billion in exports so far in 2022

Source: Statistics Canada Trade Data Online
* “HS84 Farm machinery, equipment” includes HS8432 – 8434, 8436 and 8437

Martha Roberts
Economics Editor
Martha joined the Economics team in 2013, focusing on research insights about risk and success factors for agricultural producers and agri-businesses. She has 25 years’ experience conducting and communicating quantitative and qualitative research results to industry experts. Martha holds a Master of Sociology degree from Queen’s University in Kingston, Ontario and a Master of Fine Arts degree in non-fiction writing from the University of King’s College.
