Can Ontario hold on to current land values?

The pace of growth in Canadian farmland values slowed in 2018. Despite a scarcity of land for sale, the year’s and reduced net incomes helped to push the rate of growth lower than the previous five-year average.
With average growth rates also declining in each province except B.C., we should look at that growth in relative terms. Is farmland in Canada over- or undervalued? In this post, I’m going to answer that question with a look at Ontario land values.
Why the PE ratio matters
Producers value land based on their expectations of the future revenues it will generate. Such expectations are captured in the farmland price-to-earnings (PE) ratio - which is why economists pay attention when it starts trending away from the historical average. A quickly dropping ratio may indicate land that’s undervalued, and a ratio that rises from its historical average may indicate overvalued land.
Is Ontario’s slower growth in land values tracking revenues?
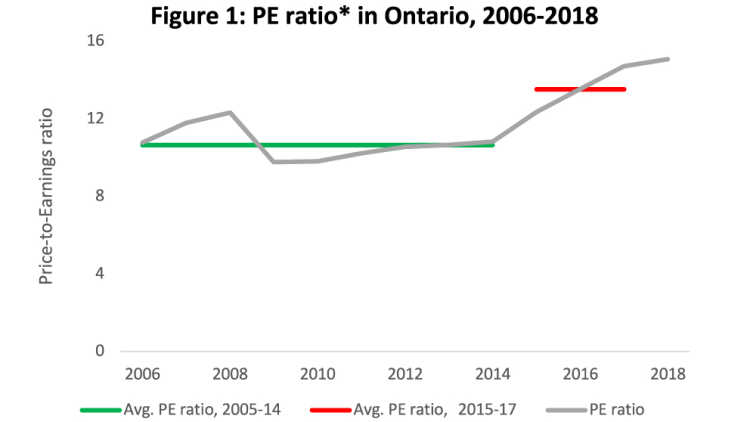
Between 2006 and 2014, Ontario’s PE ratio averaged 10.6: land prices (per acre) were almost 11 times more than receipts (per acre). The ratio’s variance over that decade didn’t stray far from the average - until 2015 when it started climbing (Figure 1).

* Average price of Ontario farmland (per acre) /Average Ontario crop receipts (per acre)
Source: Statistics Canada and FCC computation
The question is whether that PE ratio is climbing too much or too quickly. My answer? We need to monitor it, but the growth seems to come from a robust outlook for the ag economy.
Ever wonder if a province’s land values are too high or too low? Here’s what economists have to say about Ontario’s land in 2018.
Strong commodity price growth behind rising PE ratio in cash-rich Ontario
Between 2006 and 2014, Ontario’s price of farmland increased 11.1% on average each year and provincial receipts for corn and soybeans (which together contributed an average 40.0% to Ontario’s crop receipts each year during the period) grew on average 4.5% annually.
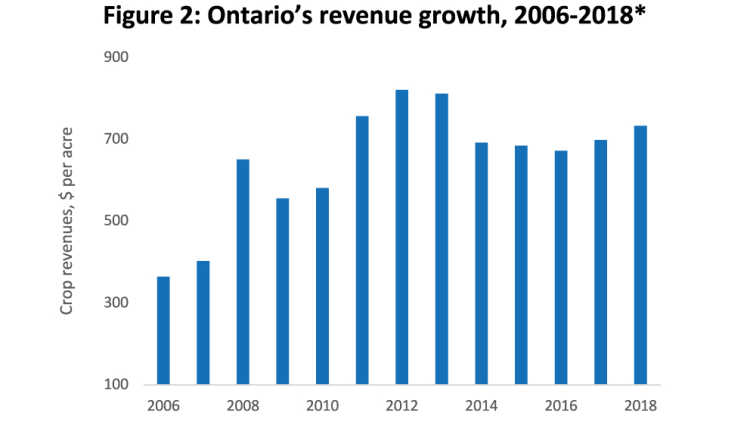
Between 2015 and 2017, the average cost of the province’s farmland continued to rise, increasing 6.8% annually. Interest rates were falling then, at a time when continued strength of global demand supported sustained expectations of strong crop revenues. But revenue growth levelled out (Figure 2).

* Ontario crop revenues based on a corn/soybean rotation
Source: Statistics Canada and FCC computation
Ontario’s soybean and corn receipts in 2012 smashed the provincial record, with the next five years’ revenues remaining well above all previous highs. The revenue growth seen in the first 10 years of Figure 2 could therefore be reasonably expected to push land values higher, and along with falling interest rates, it did.
Bottom line
Ontario’s farmland values rose 3.6% on average in 2018 - enough to push the provincial PE ratio up again. But the slowing rate of land values’ growth helped to stabilize the ratio’s recent trend away from the average. Valuing land higher when revenues are expected to rise can be a suitable business strategy. But receipts and net income both flattened in 2018. That’s not necessarily a bad news story: that occurred after the sector’s recent exceptionally strong revenue growth. It’s just not necessarily great news either.
With overall crop productivity growing annually at a modest 1 - 2% and no guarantees the lower prices of 2018 will rise in 2019 – I expect more caution in 2019’s values.
Get the full farmland values story now.

Martha Roberts
Economics Editor
Martha joined the Economics team in 2013, focusing on research insights about risk and success factors for agricultural producers and agri-businesses. She has 25 years’ experience conducting and communicating quantitative and qualitative research results to industry experts. Martha holds a Master of Sociology degree from Queen’s University in Kingston, Ontario and a Master of Fine Arts degree in non-fiction writing from the University of King’s College.