A brief review of dairy’s financial fitness

Our Financial Fitness series offers two instructional take-aways:
We must look at several ratios together to see what’s likely ahead for any one sector.
Canada’s ag sectors are healthy, but each face different headwinds arising out of very different operating environments and financial structures.
Taken together, the current, operating expense, debt service coverage and debt-to-equity ratio tell the tale of short- and long-term assets, liabilities and net worth. Those are balance sheet items that are connected a lot to a sector’s revenues and expenses – or the health on the income statement. Revenues must cover short-term expenses and debt, pay down long-term debt obligations and, ultimately, contribute to net worth.
It’s also true that debt can be used to exploit new opportunities. Taking on more debt can be a wise move which nonetheless comes with risk. Any assessment of healthy debt must include revenues, and more importantly, net income, to properly assess that debt’s potential and risk.
In this post, I’ll look at the four ratios for dairy as an example of one sector’s unique financial situation.
Canadian dairy: what lies ahead?
The milk price rebounded in late 2018, but there remain pressures on dairy margins this year. Those pressures will have to be met with efficiency gains.
Dairy ratios: 2013 - 2017
Good financial health starts with revenues. According to the Farm Financial Survey, between 2013 and 2017, Canadian dairy:
Gross revenues climbed 24.4%. With a growing surplus of solids-non-fat, the milk price fell - so expanded demand drove revenue growth.
Production increased to meet demand and operational expenses rose 25.9% with it.
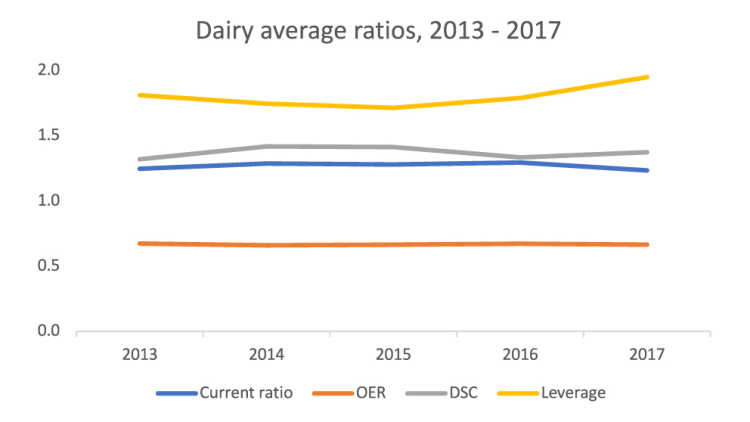
The growth in revenues wasn’t enough to offset growth in expenses. But the average operational expense ratio for the period was unchanged, meaning producers introduced efficiency gains to counteract the higher expenses (Figure 1). The average current ratio also stayed largely flat, illustrating most operations had healthy liquidities throughout the period.
Operations invested to expand their production capacity as demand climbed. These investments increased:
Total liabilities by 49.5%
Total assets 33.5%
Net worth 27.5%
The average debt-to-equity (leverage) ratio climbed with the expanded borrowing. In fact, total liabilities grew faster than both equity and revenues over the period. The average debt service capacity ratio remained healthy – meaning net income was enough to service dairy producers’ growing debt obligations. The Bank of Canada rate climbed 50 basis points in 2017 and so some dairy producers had to allocate a greater share of revenues to cover the added debt payments owing to rising interest rates.
Figure 1: Dairy has found success balancing growth on both sides of the ledger

Source: FCC portfolio data
The milk price rebounded in late 2018, but there remain pressures on dairy margins this year. Those pressures will have to be met with efficiency gains.
What you can do
The stability of the Canadian dairy sector as measured by these four financial ratios masks some important indicators. These are ratios illustrating the average producer only: numerous Canadian dairies will differ in their revenue streams, efficiencies, debt obligations and working capital. Regardless, the evolving economic environment means more revenues will be needed in 2019 to cover the long-term debt that’s recently been incurred and slower growth in the demand of dairy products.
Ratio analysis is key in managing ag operations, but full risk management goes beyond simple ratio analysis. Work with your lender and accountant to determine the suggested ratios for your specific industry and be sure to understand them according to your own strategy and the risks facing your own operation.
Jean-Philippe (J.P.) Gervais
Executive Vice President, Strategy and Impact and Chief Economist
J.P. Gervais is Executive Vice President, Strategy and Impact and Chief Economist at FCC. His insights help guide FCC strategy, monitor risks and identify opportunities in the economic environment. In addition to acting as an FCC spokesperson on economic matters, J.P. provides commentary on the agriculture and food industry through videos and the FCC Economics blog.
Prior to joining FCC in 2010, J.P. was a professor of agricultural economics at North Carolina State University and Laval University. J.P. is a Fellow of the Canadian Agricultural Economics Society. He obtained his PhD in economics from Iowa State University in 1999.
