2023 Dairy outlook update

This is the first of three quarterly updates to our 2023 Outlook for the dairy sector published in January. Last week we updated our grains, oilseeds, and pulses outlook, and next week we’ll update the outlook for cattle and hog.
The previously announced butter support price increase of 2.2% was implemented effective February 1. Our gross revenue forecasts in the outlook accounted for this increase, yet these forecasts underestimated the actual average butterfat prices for the first three months of the year. There are two reasons why. First, in the Western Milk Pool (WMP), butterfat composition in the first two months of the year was much higher than the trend over the last five years (figure 1). Butterfat composition in the east (P5) was flat and under trend. Producers in the P5, however, have benefitted from changes in the basket of dairy products purchased by consumers which we do not account for in our models. More milk going into classes with higher butterfat prices will increase the average price.
Figure 1: Butterfat composition in the WMP unseasonably high to start 2023
Average butterfat composition for January and February of each year

Source: Agriculture and Agri-food Canada
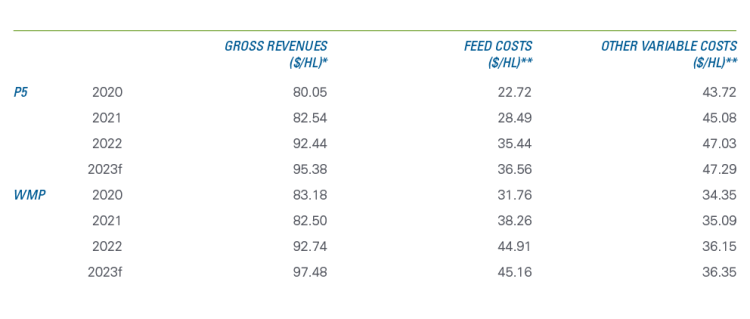
Table 1 summarizes revenues and variable costs data for 2020 to 2022 and our latest forecasts for 2023 (note we do not include capital costs and producer labour costs as these vary greatly between operations). Our updated revenue forecasts show an increase of $1.18/hl for WMP producers and $0.74/hl for producers in the P5, relative to our January estimates. Profits after financing costs remain very tight.
Table 1: Estimates of dairy farm revenues and variable costs

Sources: Calculations by FCC based on the cost of production estimates from the Canadian Dairy Commission and Government of Alberta and data from the Dairy Farmers of Ontario, Les Producteurs de Lait du Quebec, Alberta Milk, Statistics Canada and USDA.
*Gross revenues are based on data reported by producer groups, which differ from Statistics Canada data used in calculating dairy receipts.
**The calculations use different definitions of cost categories for the P5 and WMP; therefore, values are not directly comparable.
Trends to watch in 2023
In January, we identified the following items as influential factors to monitor in 2023.
1. Elevated input costs
Input costs have levelled off – we do not expect them to decline, but they are no longer increasing.
Our forecasts of feed costs for 2023 are unchanged since January. New crop futures contracts for corn indicate some relief may come towards the end of the year, but a weaker Canadian dollar will provide a floor as to how low corn prices can go this fall. Note that the feed cost estimates are opportunity costs, which means that farms able to grow their feed can do so at a lower cost.
Fertilizer prices are down and are forecast to fall further in 2023, but fertilizer makes up a small portion of total costs for dairy producers. The Bank of Canada (BoC) seems unlikely to change the overnight rate this year, so interest costs should remain a top item to monitor in the income statement.
2. Butter stock levels
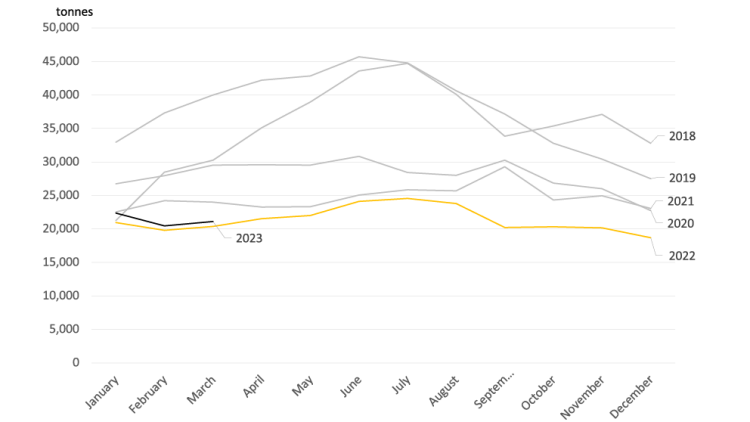
Butter stocks are still trending to be low during the year. Year-to-date, they are trending in the same direction as in 2022. The CDC’s most recent estimates are for butter stocks for December 2023 to be between 21,500 and 27,000. The lower end of that estimate would put butter stocks as of December 2023 marginally higher than they ended in December 2022.
Figure 2: Butter stocks still trending low

Source: Statistics Canada table 32-10-0001
There have been no changes to quota or incentive days in either the WMP or P5 since our outlook in January. There are still 7 incentive days planned in the P5 for the remainder of the year, while none are planned for the WMP. There have been no increases or decreases in quota.
3. Imports of dairy products
Milk prices in the US have been strong so far this dairy year, and except for butter, these strong prices seem to have limited the appeal of importing dairy products. For example, in the first 8 months of the dairy year, only 2% of negotiated milk import volumes under the Canada-United States-Mexico Agreement (CUSMA) have been filled. US milk futures have come down from their levels three months ago, so we will be monitoring whether that affects fill rates of milk for the rest of the dairy year and into 2023-24.
4. Retail price inflation
Data from the Dairy Producers Association of Canada (DPAC) shows that, on a 12-month rolling period ending December 2022, demand for cheese, yogurt, and fluid milk is down (-0.7%, -0.7% and -2.1%, respectively). Demand was up marginally (+0.2%) for butter and steadily (+1.7%) for cream.
These data, however, reflect a time before the butter support price took effect on February 1. As we’ve noted before increases in the butter support price do not translate into an equivalent and immediate increase in the retail price of dairy products. Still, it does have an effect.
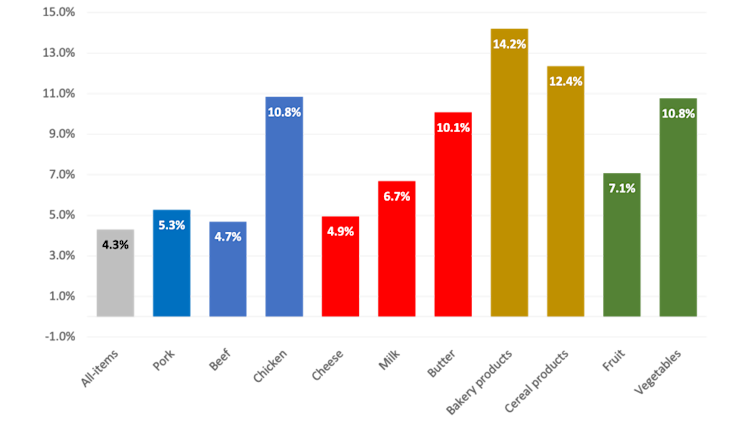
If we look at Statistics Canada’s inflation data for March, we see that dairy product price inflation is comparable to other food categories. Amongst food categories, beef, cheese, and pork are among the lowest rates as of March. Bakery products are an interesting category in that prices for dairy ingredients that go into commercial baking are based on US prices; this, in part, illustrates how strong US dairy prices have been in the last few months.
Figure 3: Food price inflation across all food categories still high

Source: Statistics Canada table 18-10-0004
Bottom line
The outlook for the dairy industry has changed little since January. Revenues have seen a small boost with greater butterfat production in the WMP and a shift in milk allocation to different classes benefitting producers in the P5. Still, input costs — particularly feed costs — will remain elevated for 2023.
Graeme Crosbie
Senior Economist
Graeme Crosbie is a Senior Economist at FCC. He focuses on macroeconomic analysis and insights, as well as monitoring and analyzing trends within the dairy and poultry sectors. With his expertise and experience in model development, he generates forecasts of the wider agriculture operating environment, helping FCC customers and staff monitor risks and identify opportunities.
Graeme has been at FCC since 2013, spending time in marketing and risk management before joining the economics team in 2021. He holds a master of science in financial economics from Cardiff University and is a CFA charter holder.
