Exploring farmland affordability trends through purchase timing and crop revenues
Canadian agriculture faced many challenges in 2022 but ultimately came out with strong farm cash receipts and positive profit margins across many sectors. With the availability of farmland for sale remaining tight, average farmland values increased 12.8% in 2022, up from the 8.3% increase in 2021. Inflationary pressures led the Bank of Canada to increase its overnight rate from 0.25% at the start of 2022 to 4.25% by the end of the year.
This post investigates land affordability related to the timing of purchase which was highly impacted by rising interest rates in Canada during 2022. In addition, we compare annual land payments against gross revenue generated by different crop rotations in western and eastern Canada. While important nuances exist across provinces, farmland is near or at its least affordable level in the last 20 years.
Calculating farmland annual payments
Most farmland is purchased with a combination of equity and debt, and affordability is a matter of land prices, financing costs, and farm revenues.
Consider a land purchase with a down payment of 25% and a loan amortized over 25 years. Let’s use the effective average business interest rate (a weighted average of market interest rates), which averaged 4.4% in 2022, up from 2.3% in 2021, to estimate the annual loan payment.
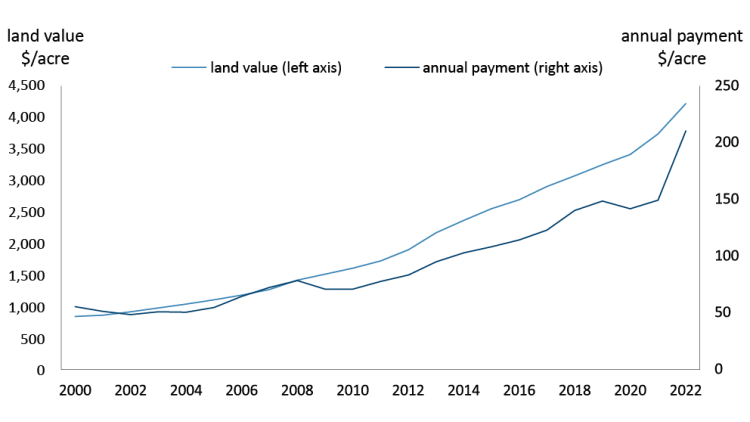
Farmland values and annual payments tend to evolve at the same pace (Figure 1). On average, Canadian farmland values have increased 8.3% annually over the last 10 years. In 2022, values rose 12.8%, the highest jump since 2013. Average annual payments increased 9.7% per year in the last decade, but 2022 recorded a large jump of 41% to $210/acre due to rising interest rates.
Figure 1. Canadian average farmland values vs. average annual farmland payments
Source: FCC Calculations
Timing is everything
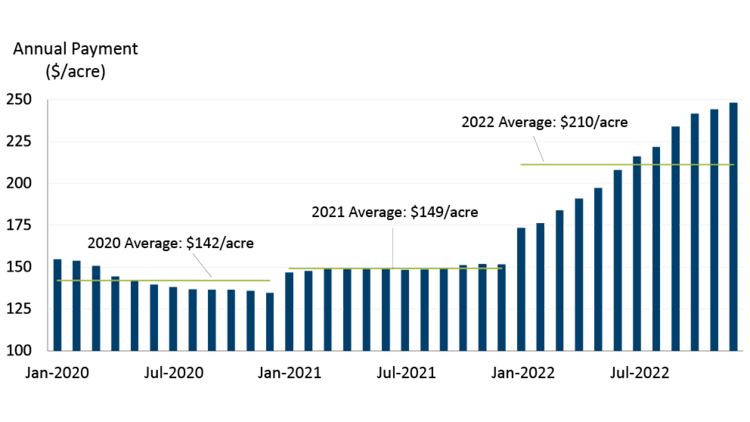
Interest rates fell through 2020, so land purchased at the start of the year had higher payments relative to land purchased at the end if it had the same purchase price (Figure 2). During 2021, interest rates stayed consistent, and land purchases at any time throughout the year would have resulted in similar payments.
In 2022, interest rates rose steadily, resulting in a large jump in payments depending on when the land was purchased. Annual payments would have been $75/acre higher at the end of 2022 than on similarly priced land at the start of the year.
Figure 2. Impact of purchase timing and interest rate on annual farmland payment
Source: FCC Calculations
Crop revenues to measure farmland affordability
Assessing average provincial yields and crop prices generate an estimate of gross revenues for soybean-corn rotations in Ontario and Quebec and canola-wheat rotations in Saskatchewan and Alberta. Farmland payments as a share of gross revenues estimate farmland affordability.
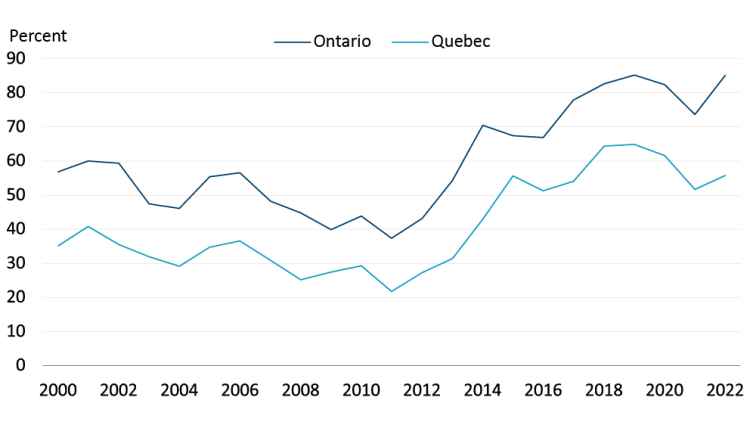
Quebec and Ontario operations recorded similar crop revenues per acre over the last decade. Farmland payments as a share of revenues differ mostly because of land prices (Figure 3). In 2022, purchasing new land in Ontario generated a land payment equal to 85% of gross crop revenue, tying 2019’s record high. Meanwhile, Quebec payments equaled 56% of gross crop revenue, just above its 10-year average. Different dynamics in the farmland market explain differences in farmland prices.
Figure 3. Annual average farmland payments as a percentage of gross crop revenue (corn/soybean rotation)
Source: FCC Calculations
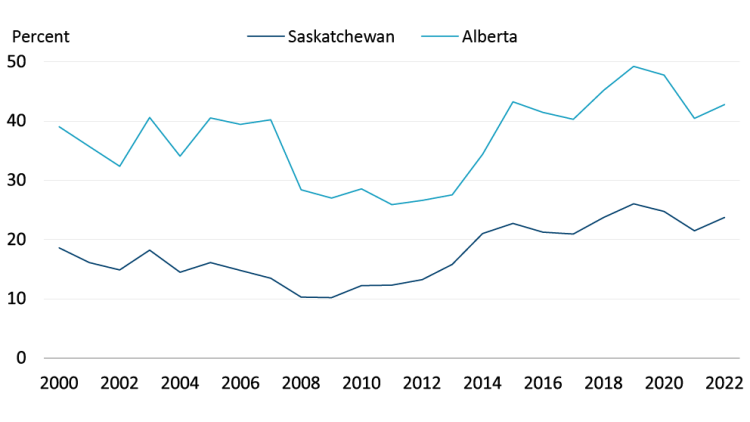
Saskatchewan and Alberta farmland values are driven predominately by grain crop revenues. In what follows, we capture a canola and wheat rotation. Land payments relative to gross crop revenue in 2022 ticked upwards (Figure 4). The Alberta ratio hit 43%, above its long-term average of 37% but below the 2019 high. Saskatchewan’s ratio was 24%, above its historical average of 18% and just below the 2019 high. Gross crop revenues have been increasing in both provinces over the last decade, but farmland values and corresponding payments are appreciating at a faster rate.
Figure 4. Annual average farmland payments as a percentage of gross crop revenue (wheat/canola rotation)
Source: FCC Calculations
What to watch for in the 2023 farmland market
After 2021’s historic low interest rates, interest rates rose quickly throughout 2022, leading to sharp price jumps in payments on newly purchased land. Interest rates are projected to remain around current levels during 2023, meaning annual land payments will remain well above a year ago. Farm cash receipts are expected to remain strong, but high farm input costs and interest expenses call for thorough assessments of the financial risks in an operation as the economic environment evolves.

Justin Shepherd
Senior Economist
Justin Shepherd is a Senior Economist at FCC. He joined the team in 2021, specializing in monitoring agricultural production and analyzing global supply and demand trends. In addition to his speaking engagements on agriculture and economics, Justin is a regular contributor to the FCC Economics blog.
He grew up on a mixed farm in Saskatchewan and remains active in the family operation. Justin holds a master of applied economics and management from Cornell University and a bachelor of agribusiness from the University of Saskatchewan.