2021 mid-year farmland values update: Uncertainty doesn’t weaken demand

Despite a drought in Western Canada and bumps in the economic recovery, robust commodity prices in late 2020 combined with low interest rates continued to support strong demand for farmland and elevated land prices.
Across the country, farmland values increased by an average of 3.8% in the first half of 2021 (Table 1). During the first half of 2021, the largest increases were in Ontario (11.5%), British Columbia (8.8%), and Quebec (8.1%). The remaining provinces recorded increases of less than 5%. The overall 12-month pace of increase between July 2020 and the end of June 2021 shows a 6.1% gain in average farmland values at the national level.
Table 1. Average farmland value increases
| Average % change Jan 2021 - June 2021 (6 months) |
Average % change July 2020 - June 2021 (12 months) |
|
|---|---|---|
| BC | 8.8 | 13.6 |
| AB | 3.7 | 5.6 |
| SK | 1.8 | 3.5 |
| MB | 3.5 | 6.3 |
| ON | 11.5 | 15.4 |
| QC | 8.1 | 13.7 |
| NB | 0.9 | 1.8 |
| NS | 4.5 | 5.8 |
| PEI | 0.4 | 1.5 |
| NL | N/A | N/A |
| Canada | 3.8 | 6.1 |
Source: FCC calculations.
Farmland values drivers - tight supply and strong demand
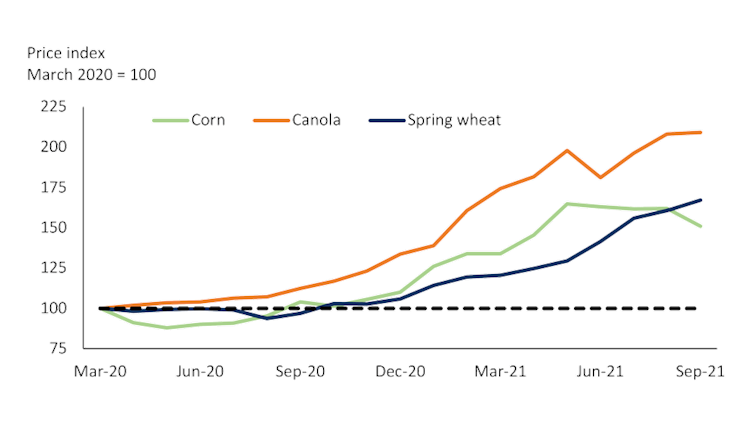
Rising commodity prices (Figure 1) in the second half of 2020 lifted farm cash receipts and provided an optimistic outlook for farm operations looking towards 2021. Receipts for grain, oilseed and pulse producers in the last six months of 2020 were 28.0% higher than for the same period in 2019. This trend continued in the first six months of 2021, with receipts being 22.6% higher than a year ago.
Figure 1. Average monthly prices for Saskatchewan canola and spring wheat and Ontario corn

Sources: Grain Farmers of Ontario, Saskatchewan Ministry of Agriculture.
- Interest rates declined at the outset of the pandemic, and borrowing costs remain historically low (Figure 2). This supports the demand for farmland and weakens the supply of available land for sale in the market, pushing land prices upward.
Figure 2. Average borrowing costs for businesses

Source: Bank of Canada.
- Many of the transactions recorded this spring were negotiated before the exceptionally dry conditions observed in British Columbia and Prairie provinces. The 2021 drought will be one of the most significant in 40 years for the Prairie provinces, primarily the southern Manitoba area. Commodity prices may remain relatively high, benefiting cash crop producers in areas where the drought will have less impact. Conversely, this will create upward pressure on the cost of production for livestock operations.
- Farmland on the outskirts of major urban centers is experiencing strong competition between agricultural producers wanting to expand their land base and hobby farmers wanting to move to the countryside, particularly in Ontario and British Columbia.
Trends by province
British Columbia: Land values increased by an average of 8.8 percent during the first six months of 2021 (an increase of 13.6 percent over the past 12 months). This is a significant increase considering that British Columbia has the highest land value per acre in Canada. The upward trend has been observed in all regions of the province, but primarily in the South Coast region due to strong competition between local farmers and non-traditional buyers.
Alberta: Increases were modest at 3.7% over six months. This is partly because some areas have experienced several poor harvest years in a row. The highest increases were primarily on the lower-priced land, while the higher-priced land was mostly stable.
Saskatchewan: The average increase of 1.8% for the first six months of 2021 and 3.5% on a 12-month basis represents the lowest increase in the last 15 years. The last time a 12-month increase of less than 5% was observed was in 2006. There is a mixed trend in the province, with the Eastern regions seeing increases in values while the Western regional values remain stable. Western areas have been experiencing drier conditions for some time.
Manitoba: Farmland values have increased by 3.5% in the first half of 2021. This growth is comparable to the increasing rates of recent years within the province. Currently, crops are being affected by drought conditions. It will be important to watch this impact on land demand in the second half of the year.
Ontario: It has seen the largest increase in the country for the first six months of 2021, with an 11.5% increase (15.4% over 12 months). The midwestern and southeast regions have seen the largest increases. Buyers from different sectors, and a migration of producers from higher-priced to lower- priced areas, are competing for the limited amount of land on the market. Demand for land on the outskirts of urban centers is also very strong.
Quebec: Most regions have seen land values continue to increase in the first half of 2021. Even those with the highest rates per acre (Montérégie and Lanaudière). There is a diversity of buyers in most regions, creating strong competition for the limited amount of land on the market.
Atlantic Provinces: The level of activity has been relatively low for the first six months of 2021 which explains, in part, the small fluctuation in values. Demand for the potato sector remains strong in New Brunswick and PEI. Demand also appears robust in Nova Scotia from growers of various crops.
Bottom line
Average land values in the first half of 2021 reveal the strength of the farmland market. Growing conditions for crop producers and the overall economic environment in the second of 2021 and into 2022 are worth watching because of their influence on the demand for farmland.
Interested in how Canadian farmland values have changed over the years? Check out our historic FCC Farmland Values Report.
Olivier Biron, É.A. agr., Manager, Valuations