2021 Maple syrup sector outlook

Canadian maple syrup production growth has been stellar the last two years, following a very slow 2018. Both Quebecois and Canadian production grew 35% in 2019 year-over-year (YoY). But in 2020, COVID-19 created a forked path within the Canadian sector, much as it has across many agricultural sectors. The big question is whether 2021 holds better days. As temperatures slowly climb, here’s how the country’s year of maple production is shaping up.
Industry at a crossroads
Canada’s 2020 production rose 8.3% YoY, and in Quebec, the world’s largest producing region, production grew 9.8%. Canada’s annual tally of exports of sugar/syrup rose 20% YoY, with a similar pace expected in 2021. Domestic syrup sales have also done well despite the pandemic.
According to Nielsen data, 2020 sales in dollars rose 20.1% YoY and sales in volumes rose 15.2%. Prices saw a small decrease in New Brunswick in 2020 YoY but were stable in Quebec. While COVID-19 has introduced price volatility for many foods, it’s unlikely to impact maple syrup prices this year. It has disrupted consumption patterns of different ingredients, however. Non-sweet condiments (e.g., mustard) rely on foodservice sectors; consumption has therefore declined. But while consumption of sweet condiments has also generally declined due to health-related concerns, maple syrup is an exception.
Restaurants hit hard
North America’s maple syrup consumption patterns during COVID have exposed an industry fault line. Fully one-quarter of Quebec’s 220 sugar shacks/restaurants registered before COVID have had to shut down all operations because of restaurant restrictions. Another 25% have modified their operations to only produce syrup. With Quebec’s current closure orders, continued shuttering of eat-in dining could force others to do so as well. Those who’ve been able to offer take-out meals have managed well, but 2021 may be a year of unprecedented supply-side restructuring in the world’s heart of maple syrup production.
That serious business downturn occurred in a year of near-record production. Although production in Ontario and New Brunswick decreased slightly, 2020 was an excellent year for Quebec with an average 3.59 lbs./tap. That compares to the 5-year average of 3.29. With favourable weather this spring, another good year of production should follow.
U.S. ramps up competition for global markets
U.S. production was slightly less in 2020 (3.56 lbs./tap), but it still compares favourably to its 5-year average (2015-2019) of 3.38 lbs./tap. Overall U.S. production grew 4.6% YoY on 13.5 million taps (compared to more than 48 million taps in Quebec). The U.S. sector continues to make headway into global markets, seemingly limited now only by fewer taps than Canada.
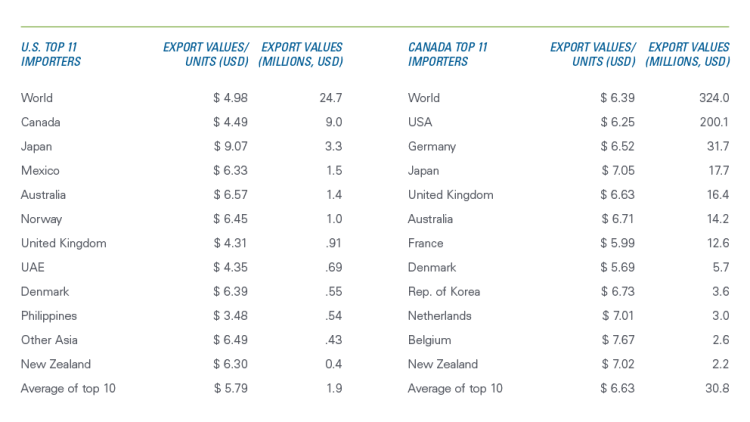
The U.S. exports to markets Canada doesn’t, although we share many of the same large importers. They also export at lower average unit values than those of Canadian syrup (Table 1).
Table 1: 2019 export totals and unit values of top Canadian and U.S. export destinations of maple sugar and syrup (HS code 170220)

Source: UNComtrade.
Diversification of Canadian exports has been slow since at least 2015, except for China. In 2020, it was not yet a Top 10 importer of Canadian maple syrup, but between 2015 and 2020, its imports of Canadian syrup grew at an annual average rate of 11%, to $1.2 million. Despite some growth in other small markets, the sweet sap remains a North American delicacy – in both production and consumption. Canada exports to a concentrated market, with the U.S. buying around 60% of total Canadian exports. And the U.S., the only other producer of maple syrup in the world, exports its largest share of total exports to us.
A shifting industry structure
The pursuit of economies of scale prompts producers to grow their production while sliding down the cost curve. Even as total costs rise, average costs can fall as capacity is expanded. In 2016 (latest available data), average variable costs of water-to-syrup production using a classic oil evaporator were 10% lower for farms with 40,000 taps relative to those with 20,000 taps. That alone can drive an industry to consolidate.
In a year of possible major re-structuring, technology offers further incentives to expand. Electric evaporators and monitoring systems that track leaks, breaks and frost are two such examples, each requiring a certain scale to become profitable. Electric evaporators cost less to run than the heated oil evaporators still used on most farms. But, despite improved cost benefits, it’s an innovation still found primarily on only the largest farms. And while they allow improved supervision, productivity and less labour, the monitors require a WIFI connection that’s not always available and a threshold of number of taps to justify the purchase.
The weather, as always, will dictate the success of production in 2021. But the decisions producers make for their businesses, both planned and unplanned, during the upheaval caused by COVID are just as important. Here’s how one producer in New Brunswick is doing it.

Martha Roberts
Economics Editor
Martha joined the Economics team in 2013, focusing on research insights about risk and success factors for agricultural producers and agri-businesses. She has 25 years’ experience conducting and communicating quantitative and qualitative research results to industry experts. Martha holds a Master of Sociology degree from Queen’s University in Kingston, Ontario and a Master of Fine Arts degree in non-fiction writing from the University of King’s College.