2021 Canadian food and ag trade update: Differentiating between demand strength and inflation

Canada has the potential – and is expected – to become one of five primary sources of safe, reliable, nutritious ag commodities and food products as the global population balloons toward 10 billion. Based on the Advisory Council on Economic Growth’s (Barton Report) recommendations, the 2017 federal budget included funds for expanding exports to at least $75 billion by 2025 (from $55 billion in 2015). In 2018, the national Agri-Food Economic Strategy Table upped those targets to $85 billion by 2025.
Pandemic-led inflation boosts export performance
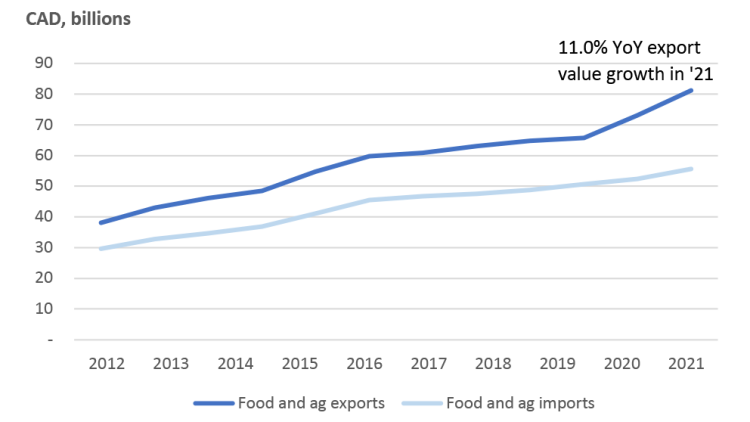
Between 2012 and 2019, total agri-food year-over-year (YoY) export value growth averaged 5.2% (Figure 1). In 2020, it jumped to 11.4% and declined only slightly in 2021 to 11%. As a result, total agri-food export values climbed to $81.2 billion last year.
Figure 1: Pandemic boosts total agri-food export values and trade surplus
Source: Canadian International Merchandise Trade
Ag includes HS01 (live animals), 03 (aquatics), 06 (live plants), 07 (vegetables), 08 (fruits), 10 (cereals), 12 (oilseeds)
Food includes HS02 (meat), HS04 (dairy), HS09 (coffee), HS11 (milled products), HS15 (fats and oils), HS16 (meat preparations), HS17 (cocoa), HS18 (sugar), HS19 (cereal preparations), HS20, HS21 (misc. preparations), HS22 (beverages), HS23 (residues and waste) and HS35 (albuminoidal substances)
COVID-19 has also strengthened Canada’s overall agri-food trade surplus, which has widened despite growth in Canadian imports. These grew at an average annual rate (AAR) of 5.9% between 2010 and 2021, but exports grew at a 7.2% AAR. In 2010, the surplus was $8.5 billion; that grew to $25.6 billion last year.
Canada’s ag exports
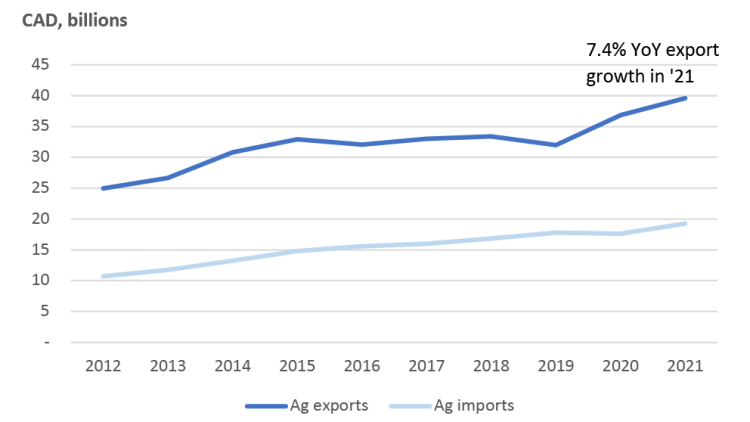
Growth in the surplus has come primarily from the success of Canadian ag exports. Overall export values for the seven agriculture HS categories grew 15.3% YoY in 2020 and 7.4% in 2021 (Figure 2). That particularly strong growth in exports has pushed the trade surplus higher.
Figure 2: Global demand for ag commodities still high, but cools in COVID Year 2
Source: Canadian International Merchandise Trade
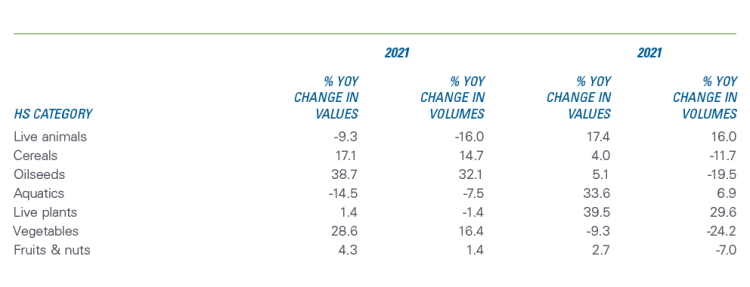
To understand the drivers of export growth, we broke out the growth in volumes and values to see if the inflation of 2021 played a role (Table 1). It shows that even when values decreased YoY (e.g., vegetables in 2021), the fall was relatively smaller than a corresponding fall in volumes. Similarly, declines in export volumes of cereals, oilseeds, fruits and nuts did not result in lower export values.
Table 1: Ag export growth
Source: Canadian International Merchandise Trade
Growth in volumes didn’t keep up to the pace of growth in values – higher prices seem to have contributed more to overall export growth than increases in the volume of commodities exported. That was the case for some sectors in 2020, but 2021 saw higher unit prices than those in 2020.
Growth in food exports leads to a higher trade surplus
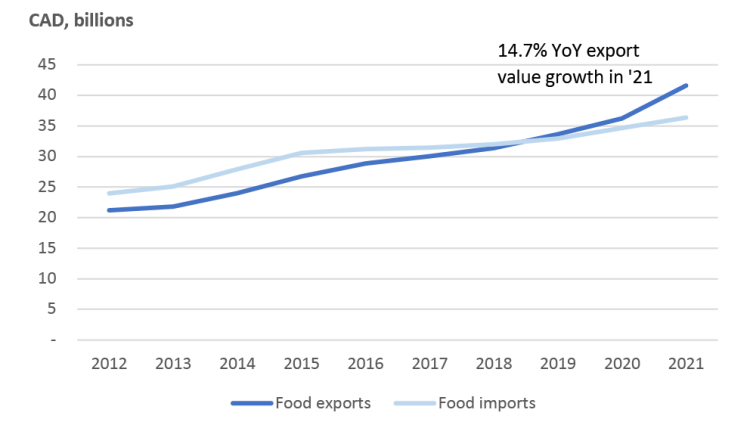
The drivers of growth in food exports appear to be similar. In 2021, Canadian food export values drove much of the overall agri-food export expansion with 14.7% YoY growth, reaching $41.6 billion (Figure 3). Those gains further deepened Canada’s food trade surplus. While the surplus is recent, reversing a long-held trade deficit, it’s built more on an uptick in exports rather than a slower pace of imports.
Figure 3: Recent growth in food export values produces trade surplus
Source: Canadian International Merchandise Trade
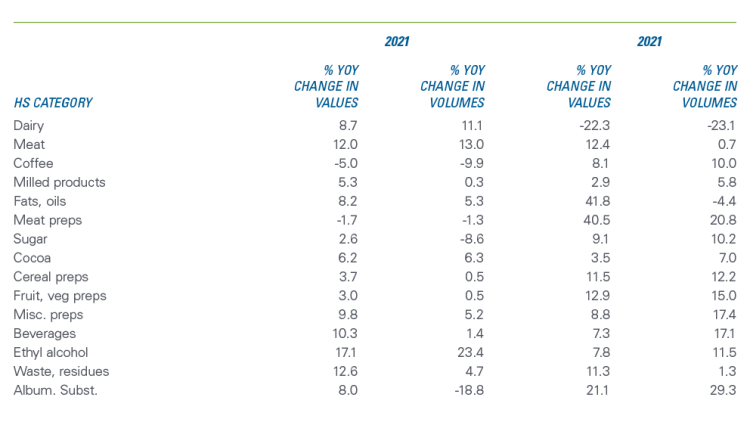
While our overall food export values have benefitted from some inflationary pressures in 2020 and 2021, export volumes also grew (Table 2).
Table 2: Food export growth
Source: Canadian International Merchandise Trade
Not surprisingly, export values of meats and meat preparations were raised by higher prices in 2021. China led the strong global demand in 2020 that helped increase Canadian pork export volumes to China, which then fell in 2021. Export values of fats/oils were 42% higher YoY in 2021, but that is mostly a function of higher prices after the Western drought decimated the canola crop.
Much of the volume growth came from Canada’s exports with the smallest export volumes.
Bottom line
Canadian exporters exceeded the original goal of $75 billion in 2021, with exports totalling $81.2 billion. But there’s a caveat. When goals are values-based (and not based on increases in volumes), inflation can account for some of that success. Capacity building and productivity gains are the bedrock of growth and export performance, but in 2020 and 2021, inflation played a role.

Martha Roberts
Economics Editor
Martha joined the Economics team in 2013, focusing on research insights about risk and success factors for agricultural producers and agri-businesses. She has 25 years’ experience conducting and communicating quantitative and qualitative research results to industry experts. Martha holds a Master of Sociology degree from Queen’s University in Kingston, Ontario and a Master of Fine Arts degree in non-fiction writing from the University of King’s College.