Seafood preparation: 2025 FCC Food and Beverage Report

The following information is from the 2025 FCC Food and Beverage Report, which highlights the opportunities and challenges for Canadian food manufacturers by sector. To get the big picture, read the full report.
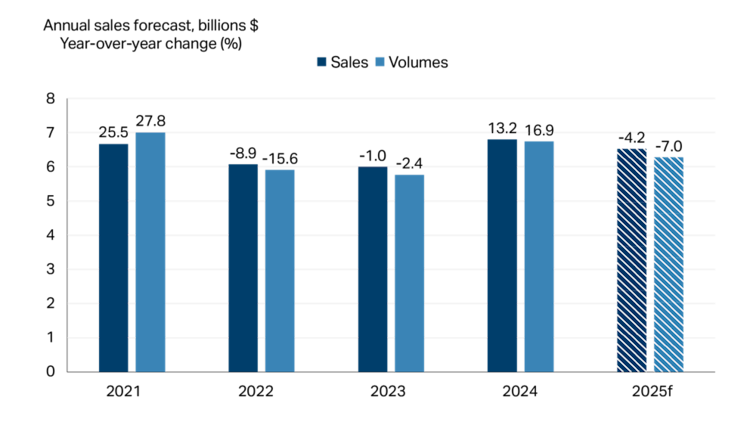
As anticipated in last year’s FCC Food and Beverage Report, seafood preparation sales rebounded in 2024. Sales increased 13.2% while volumes (that is, sales adjusted for inflation) jumped 16.9%. After this rebound, sales and volumes are forecast to fall in 2025 but not wipe out all the gains from 2024 (Figure 1).
Sales depend on the relative price versus other proteins like beef, pork and chicken. In 2024, prices for fish and seafood products declined -1.3%, contrasting sharply with price increases for beef, poultry and pork. A similar trend happened in the U.S., Canada’s largest market for sales. Fish and seafood product prices increased 0.9%, which was slower than beef and pork and slightly above poultry. This partly explains last year’s rebound in the sector’s sales.
Figure 1: Lower sales expected in 2025 following one year of growth

Total sales and volumes (in $, billions) are on the vertical axis and shown by the height of each bar. The number above each bar is the year-over-year growth as a percent. Volumes are sales deflated by a price index (202001 = 100).
Sources: FCC Economics, Statistics Canada
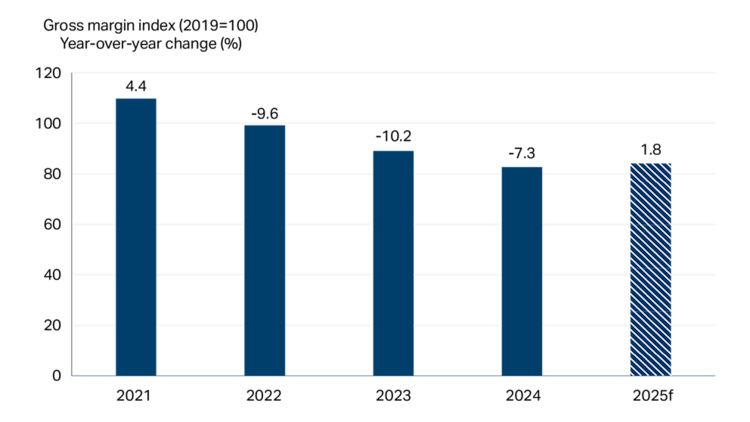
However, the sector faced challenges in 2024 as margins fell for the third year in a row (Figure 2). Fish, crustaceans, shellfish and other fishery products accounted for three-quarters of raw materials (that is, excluding wages) by value, according to Statistics Canada. This reliance on a few products means margins within the seafood processing sector are heavily tied to prices of fish and seafood. These prices are highly variable, depending on natural conditions in the waters that dictate the supply and quality of fish and seafood products available during harvest. Challenges with both supply and quality in 2024 pushed prices up. Although we anticipate a small margin bump in 2025, prolonged trade disruptions impacting Canadian exports will likely wipe away any positive margins for the sector this year.
Figure 2: Seafood preparation margins struggling, trade disruptions will make it worse

Sources: FCC Economics, Statistics Canada
Market insights: Export markets continue to drive sales
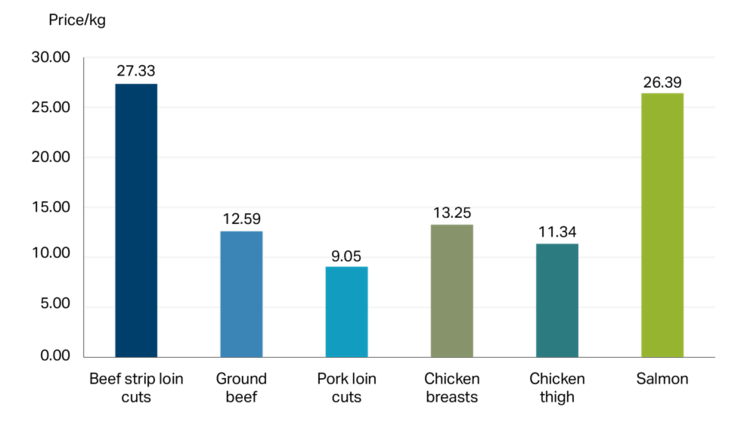
The domestic market makes up a small percentage (about 20%) of seafood preparation business sales, as most goes to the global market. Fish and seafood are not staples for most households in Canada. Even though they’re a healthy, low-fat protein option, increasing per capita fish and seafood consumption in Canada has always been an uphill battle. Fresh fish and seafood products can be priced higher than other protein sources, which can be an obstacle for consumers, especially when money is tight (Figure 3).
Figure 3: Salmon price per kilogram comparable to strip loin steak, much higher than chicken and pork

Sources: Statistics Canada, FCC calculations
Seafood sales are also cyclical in Canada. Fresh seafood sells best in the summer months and around holidays. Frozen seafood is less cyclical, with sales stronger over winter. Sales of canned seafood are less dependent on the season and are more dependent on income.
Instead, the sector relies on exports to drive sales. Fisheries and Oceans Canada forecasts global consumption of seafood products to grow over the next three years, supported by rising incomes worldwide.
In fact, 80% of sales from the sector in 2024 headed out of the country. After two years of declines, exports were up 10% in 2024. The U.S. is the primary market for Canada’s seafood products, mainly lobster, crab and salmon. According to NOAA Fisheries, U.S. per capita consumption of fishery products was 19.7 pounds per person in 2022, down slightly from 20.5 in 2021. While inflation pressured consumption of fresh and frozen products in 2022, canned products increased. China ranks second, accounting for 12%.
Other trends to watch
The Comprehensive Progressive Trans-Pacific Partnership (CPTPP) and the Canada-European Trade Agreement (CETA) have expanded Canada’s access to numerous markets, including Japan, Malaysia, Vietnam, New Zealand and the EU.
It will be interesting to see how Canada can use those agreements to diversify markets.
Canadians demand affordable, prepared, and packaged seafood products as a lower-priced option compared to fresh. However, the sector faces fierce competition from lower-priced imports in this category.
The adoption of technology to process seafood using robotics and automated processes is helping reduce labour costs, increase product consistency and improve traceability. It’s easier for larger businesses to adopt these technologies due to the ability to spread fixed costs over larger production.

