Bakery and tortilla products: 2024 FCC Food and Beverage Report

The following information is from the 2024 FCC Food and Beverage Report, which highlights the opportunities and challenges for Canadian food manufacturers by sector. For the most recent FCC Food and Beverage report, click here.
Sales will trend up, but profitability remains pressured
Over the last two years, bakery and tortilla products have seen double-digit growth rates yearly, with most sales growth resulting from inflation. Volume growth is estimated to have been -1.0% and 0.0%, respectively, in the last two years.
FCC forecasts nominal sales to decline -3.4% in 2024, but volumes should see growth of 4.3% (Figure 1).
Figure 1: Bakery and tortilla product sales are expected to decrease, but volumes will increase in 2024
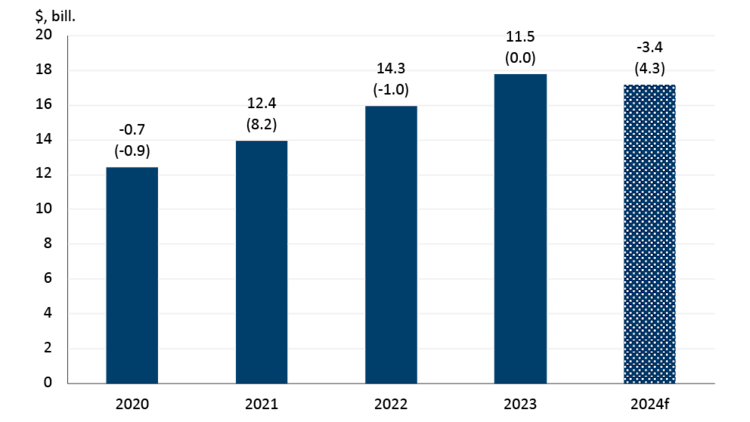
Total sales (in $, billions) are on the y-axis. The top number above each bar is the year-over-year growth in sales measured in dollars. The bottom number above each bar (in parentheses) is the year-over-year growth in volume sold. Volumes are reported sales deflated by a price index (January 2020 = 100).
Sources: FCC Economics, Statistics Canada
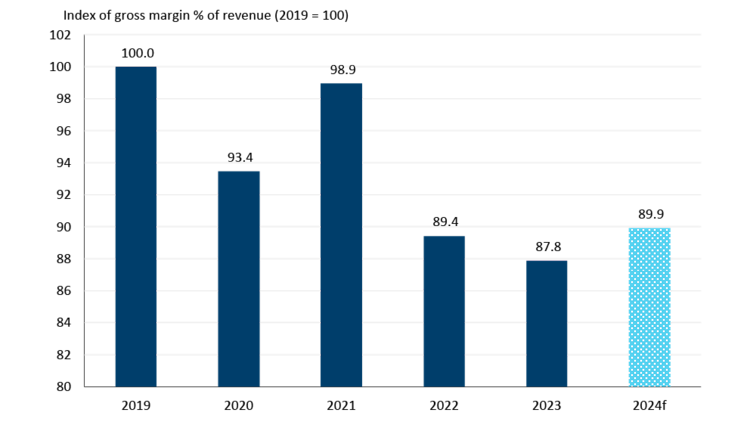
Declining flour prices in 2024 will lower raw input costs and decrease bakery and tortilla manufacturing selling prices by the end of the year. This will allow more volumes to be shipped and provide a small boost to profitability (Figure 2). However, margins will remain below 2021 levels.
Figure 2: 2024 bakery and tortilla manufacturing margins to improve
Source: FCC Economics
FCC Economics spotlight: Lower flour prices expected in 2024
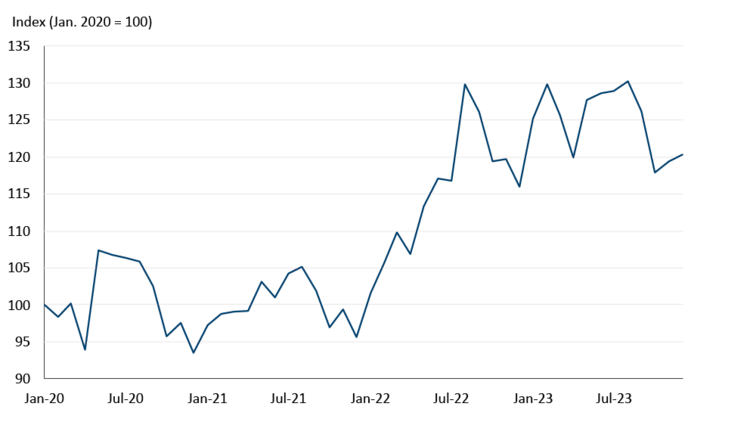
Canadian flour prices have sharply increased over the last couple of years (Figure 3) due to a small Canadian wheat crop in 2021, high global wheat prices and higher production costs for flour mills.
Figure 3: Flour prices have remained elevated since 2022
Source: Statistics Canada
Lower wheat prices in 2023 did not translate into lower selling prices for flour mills. We expect this to occur in 2024, as it can take about six to 12 months for wheat price changes to flow through the supply chain and impact flour prices.
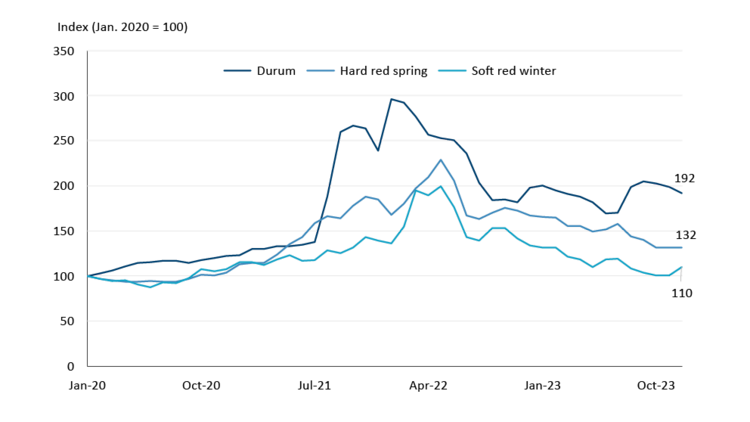
Different wheat varieties are used for different purposes, with durum primarily used in pasta, hard red spring in bread, and soft red winter in cookies, crackers, cakes, etc. Prices for all these varieties have retreated significantly from their 2022 highs, most notably soft red winter where prices are now in line with 2020 (Figure 4). Durum prices are still 92% higher than in winter 2020 due to poor production in key North American growing regions in 2023. Despite drought concerns, 2023 was a better-than-expected year of production of major wheat varieties used in baked goods. (For more on flour production, refer to the grain and oilseed manufacturing milling outlook).
Figure 4: Different wheat variety prices have eased from their 2022 highs
Source: Statistics Canada, Barchart, FCC Economics
The outlook for other ingredients is mixed. Class 5 butter – used as an ingredient in further processing, not retail butter – declined 25% in 2023. The price of this butter is based on U.S. prices, which the USDA expects to remain relatively flat in 2024. Given the price outlook for sugar and cocoa, it will be a tighter year for bakeries producing sweet products. (Refer to our Sugar and Confectionery Products outlook for more on sugar and cocoa).
Nearly 40% of bread and baked goods sales are derived from exports, and the U.S. is the largest consumer, importing 95% of our baked goods. Exports by volume were up 3.1% in 2023, a good performance but significantly lower than the export growth of the previous two years (8.8% and 12.2%, respectively).
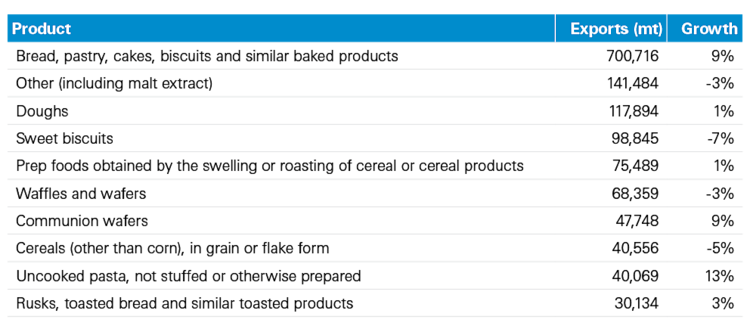
Table 1 highlights the different types of baked goods shipped to the U.S. in 2023. Unfortunately, we cannot break out into greater detail what types of 'bread, pastry, cakes and biscuits' drove the 9.0% sales growth in 2023, which is the largest product category in terms of quantity of sales.
Table 1: Bakery goods exports to the U.S., 2023
Source: CIMT Database
Other trends to monitor in 2024
Given the convenience factor, cookie and cracker demand will remain strong, and research has shown consumers tend to treat themselves to smaller, lower-cost indulgences in challenging economic times.
With eye-watering meat prices and consumers looking for added health benefits in packaged food products, consumers are demanding snack foods with added protein, even as a meal substitution. According to Mondelez International, one of the largest global food manufacturers, 55% of consumers made a meal from snacks at least weekly in 2022.
Opportunities to meet diversifying consumer demands in the bread and snacking space are abundant. Non-wheat flour (almond, coconut, chickpea, flaxseed and oats) demand is growing to meet changing consumer preferences for whole-grain, gluten-free and artisanal products. According to new product launch statistics, high-protein bread is the U.S.'s fastest-growing segment of the bread market. More gluten-free cookie and cracker products are also being introduced to meet growing demand.

